- Volume 10; 2026
- Volume 9; 2025
- Volume 8; 2024
- Volume 7; 2023
- Volume 6; 2022
- Archive
- Editorial Board
- Cover Suggestion
- Index & Coverage
- Special Issues
Introduction
Results
Discussion
Conclusion
Materials and Methods
Acknowledgements
Supplementary Material
References
International Journal of Biological Sciences
International Journal of Medical Sciences

 Global reach, higher impact
Nanotheranostics 2018; 2(3):258-268. doi:10.7150/ntno.26208 This issue Cite
Research Paper
Clinically-Applicable Perfluorocarbon-Loaded Nanoparticles For In vivo Photoacoustic, 19F Magnetic Resonance And Fluorescent Imaging
Edyta Swider1*, Khalid Daoudi2*, Alexander H. J. Staal1, Olga Koshkina1, N. Koen van Riessen1, Eric van Dinther1, I. Jolanda M. de Vries1,3, Chris L. de Korte2, Mangala Srinivas1 ![]()
1. Department of Tumor Immunology, Radboud University Medical Center, Nijmegen, The Netherlands
2. Medical UltraSound Imaging Center (MUSIC), Department of Radiology and Nuclear Medicine, Radboud University Medical Center, Nijmegen, The Netherlands
3. Department of Medical Oncology, Radboud University Medical Center, Nijmegen, The Netherlands
*Both authors contributed equally
Received 2018-3-26; Accepted 2018-5-14; Published 2018-6-1
Abstract

Photoacoustic imaging (PAI) is an emerging biomedical imaging technique that is now coming to the clinic. It has a penetration depth of a few centimeters and generates useful endogenous contrast, particularly from melanin and oxy-/deoxyhemoglobin. Indocyanine green (ICG) is a Food and Drug Administration-approved contrast agents for human applications, which can be also used in PAI. It is a small molecule dye with limited applications due to its fast clearance, rapid protein binding, and bleaching effect.
Methods: Here, we entrap ICG in a poly(lactic-co-glycolic acid) nanoparticles together with a perfluorocarbon (PFC) using single emulsion method. These nanoparticles and nanoparticle-loaded dendritic cells were imaged with PA, 19F MR, and fluorescence imaging in vitro and in vivo.
Results: We formulated particles with an average diameter of 200 nm. The encapsulation of ICG within nanoparticles decreased its photobleaching and increased the retention of the signal within cells, making it available for applications such as cell imaging. As little as 0.1x10⁶ cells could be detected in vivo with PAI using automated spectral unmixing. Furthermore, we observed the accumulation of ICG signal in the lymph node after subcutaneous injection of nanoparticles.
Conclusion: We show that we can label primary human dendritic cells with the nanoparticles and image them in vitro and in vivo, in a multimodal manner. This work demonstrates the potential of combining PAI and 19F MRI for cell imaging and lymph node detection using nanoparticles that are currently produced at GMP-grade for clinical use.
Keywords: nanoparticles, multimodal imaging, perfluoro-15-crown-5-ether, indocyanine green, 19F MRI
Introduction
Photoacoustic imaging (PAI), also called optoacoustic imaging, is a rapidly growing imaging technique in biology and medicine thanks to its unique ability to image optical contrast at depths of a few centimeters with the resolution of ultrasound, a combination never before available for optical imaging. PAI is based on the thermoelastic effect, where absorption of pulsed light by endogenous or exogenous chromophores leads to instantaneous volume expansion due to transfer of light energy into thermal energy, resulting in generation of acoustic waves at megahertz frequencies.1,2 These waves are detected by an ultrasound transducer and reconstructed to form an image of the adsorbed optical energy.3 PAI has been utilized with success for a variety of biomedical applications, such as the measurement of angiogenesis and blood oxygen saturation,4 detection of metastasis in melanoma patients,5 breast imaging,6 synovitis in finger joint,7 needle guidance,8 and preclinical imaging of specific tumor cell types with the use of targeted nanoparticles.9 Furthermore, PA molecular imaging can visualize and quantify physiological processes non-invasively at molecular and cellular levels which may provide an opportunity to detect stage, as well as predict and monitor the development of disease.10
There are several endogenous chromophores exploited by photoacoustic molecular imaging, including melanin, oxy- and deoxyhemoglobin, and lipids.11 However, despite their intense optical absorption, these chromophores provide access to limited range of biological processes, often with variations and inconsistency in many physiological or pathological cases. The use of exogenous agents, therefore, could unlock the understanding of unlimited disease processes and provide a signal at depths not possible with naturally occurring chromophore. Exogenous contrast agents with strong absorption in the near infrared (NIR) region, where biological tissues are relatively transparent and optical attenuation is weaker, are being intensively investigated. They can be divided into several major groups, as reviewed elsewhere11,12: organic dyes, fluorescent proteins, metallic and semiconducting nanostructures13,14, organic nanostructures, and multimodal agents.
Small molecule NIR dyes are the first class of photoacoustic contrast agents as they are readily commercially available. Indocyanine green (ICG) is a US Food and Drug Administration-approved dye with low toxicity, and can be used for both fluorescence and photoacoustic imaging.11 In aqueous solution, ICG has the maximum absorption at 780 nm and a relatively low quantum yield for fluorescence.11 ICG shows high plasma protein binding and it has been used for rapid blood volume measurements, angiography, ophthalmology, and sentinel lymph node detection.15 Nevertheless, ICG can be rapidly cleared from the blood stream and lacks targeting abilities. Several research groups have been developing contrast agents encapsulating ICG for pre-clinical investigation to overcome these limitations, for example phase-shift PFC droplets16 or PFC double emulsions, although these agents are not suitable for 19F MRI or cell labelling. Overall, despite the large variety of contrast agents being developed and investigated in several applications, there is still a lack of reliable and effective contrast agents approved for clinical use.
In this work, we report on polymeric nanoparticles encapsulating an imaging agent that has been recently approved for a clinical trial for in vivo cell tracking of cell therapies (ClinicalTrials.gov Identifier: NCT02574377). These nanoparticles consist of poly(D,L-lactic-co-glycolic acid) (PLGA) entrapping perfluoro-15-crown-5-ether (PFCE) and ICG dye. Due to its 20 chemically and magnetically equivalent fluorine nuclei, PFCE has been applied as an imaging label for 19F MRI.17 We have previously reported on the use of PFCE-loaded nanoparticles as 19F MRI contrast agents.18-22 Here, we investigate their photoacoustic effect and their use as in vivo multimodal contrast agents for PA and fluorescence through incorporated ICG, and 19F MR through the PFCE. PFCE-loaded nanoparticles are of special interest as their size and surface chemistry can be modified, e.g. with antibodies for targeting therapy and delivery.20,21 Thus, we effectively combine the ease and sensitivity of PAI with the penetration and quantitative capabilities of the slower 19F MRI. In this study, we first characterize the PLGA-PFCE-ICG nanoparticles and compare their optical absorption stability with free ICG dye, then perform PA measurements of nanoparticles in vitro in a gel phantom and in vivo either after direct injection in a murine thigh muscle or in lymph nodes after subcutaneous injection. We also demonstrate the multimodality aspect of the nanoparticles and, finally, we investigate the PA signal detection and intensity of primary human monocyte-derived dendritic cells (DCs) loaded with nanoparticles, both in vitro and in vivo.
Results
Characterization of nanoparticles and their photoacoustic properties
PLGA-PFCE-ICG nanoparticles (Fig.1A) were synthesized using a miniemulsion method and characterized with several techniques to determine their physical properties. We were able to synthesize nanoparticles with an average hydrodynamic diameter of 200 nm (range of 100-400 nm) and a relatively narrow size distribution measured using Dynamic Light Scattering (DLS) (Fig. 1B). With cryogenic Scanning Electron Microscopy (cryoSEM) we further looked at the size as well as the morphology of the nanoparticles (Fig. 1C). CryoSEM results show the presence of smaller and larger particles with an average diameter of 210 nm ±58 nm (100 nanoparticles counted). PFCE encapsulation was at 1.1x10¹⁹ 19F's per mg of nanoparticles (NMR spectrum of PFCE shown in Fig.1D). The encapsulation efficiency of ICG was at 33% (0.0022 mg ± 0.001 mg ICG per 1 mg of nanoparticles). Furthermore, we measured PLGA-PFCE-ICG nanoparticles with fluorescence imaging and detected strong fluorescence signal (Fig. 1E). To confirm the clinical applicability of the PLGA-PFCE-ICG nanoparticles imaging platform, we imaged a phantom with a clinically applicable concentration of nanoparticles on a clinical MRI setup. The concentration of nanoparticles was based on previous labeling results.19 The phantom, with a clinically applicable 19F concentration, was imaged with a SNR of 2.7 (Sphantom/Snoise) within 6:30 min on a 3 T human scanner (Fig. 1F).
Nanoparticle characterization. (A) The structures of main components of nanoparticles. (B) Size distribution based on dynamic light scattering measurement (C) Cryogenic Scanning Electron Microscopy (D) 19F NMR spectrum of PLGA-PFCE-ICG nanoparticles in D2O, here Trifluoroacetic acid (TFA) was used as a reference. (E) Fluorescence image of nanoparticles at the concentration of 10 mg/ml. Nanoparticles were excited at 745 nm (F) 19F MR image of 1 mg/ml nanoparticles in a phantom acquired on a clinical scanner (false color). (G) PA spectrum of nanoparticles and free ICG dye measured in vitro.
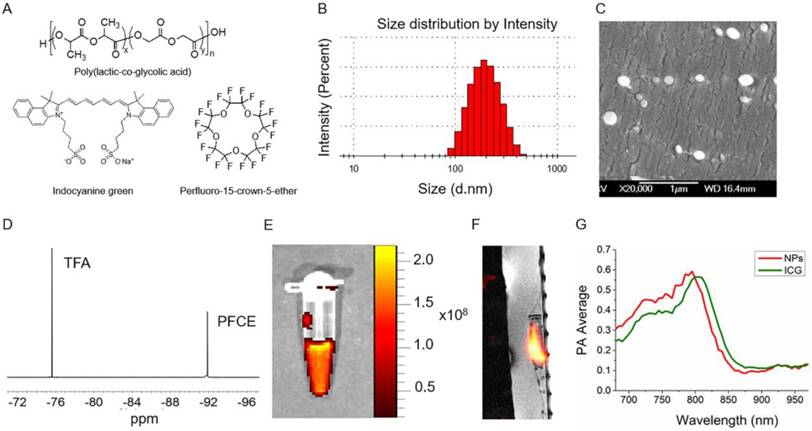
To determine the photoacoustic properties of PLGA-PFCE-ICG nanoparticles, we resuspended nanoparticles in a phosphate buffered saline at pH 7.4 and placed samples in a gel phantom. We compared the results to free ICG dye at the same concentration. The result presented in Fig. 1E shows a small hypsochromic shift of the absorption maximum of nanoparticles from 805 nm to 795 compared to free ICG. This change can be attributed to possible small concentration differences between both samples, since it is known that absorption peak of ICG can be affected by the changes in its concentration or by changes in the chemical environment of the dye.23 Nevertheless, the nanoparticles had a clear absorption peak, which was in accordance with the standard absorption peak of ICG in aqueous solution, indicating its successful incorporation in the particles.
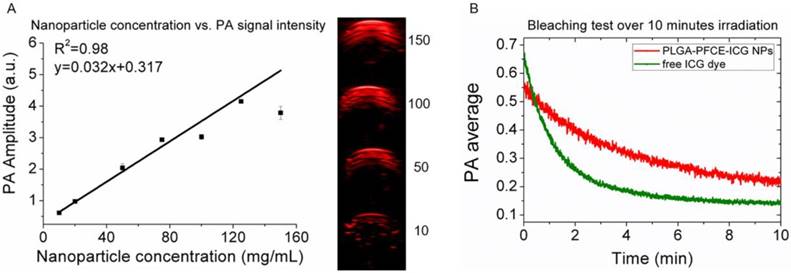
We have previously shown the relation between nanoparticle concentration and fluorine signal with MRI,22 therefore here we focus on PAI. As the absorption peak amplitude or PA signal intensity can change with the concentration of dye, we measured different concentrations of nanoparticles in a gel phantom and examined the generated contrast. Fig. 2A shows the maximum signal amplitude of a gelatin phantom filled with different concentrations of PLGA-PFCE-ICG nanoparticles at 800 nm. The corresponding PA amplitude as the function of the concentration is exhibiting an excellent linear relationship (R2=0.98) (Fig. 2A). Furthermore, we compared the stability of PLGA-PFCE-ICG nanoparticles with free ICG dye. Nanoparticles and a solution of free ICG dye, which matched the concentration of the dye in particles, were placed in a tube and imaged continuously for 10 minutes at 800 nm (Fig. 2B). The PA signal of free ICG dye decreased by 63% in about 2 minutes, while the signal of PLGA-PFCE-ICG nanoparticles after 2 minutes of irradiation decreased by 25% and was still above background level at 10 minutes. This behavior indicates that encapsulation strongly decreases the bleaching effect of the ICG dye, and thus increases the effective length of time in which the imaging agent can be followed.
Influence of nanoparticle concentration and nanoparticle stability for PAI. (A) Graph showing the relationship between PA signal nanoparticle concentration, together with images showing the signal intensity of nanoparticles at various concentrations (mg/mL). The numbers in the panel represent the concentration in mg/mL. (B) Signal stability of PLGA-PFCE-ICG nanoparticles and free ICG dye over 10 minutes of continuous PAI, with the dye at the same concentration in both.
Multimodal in vivo detection of PLGA-PFCE-ICG nanoparticles
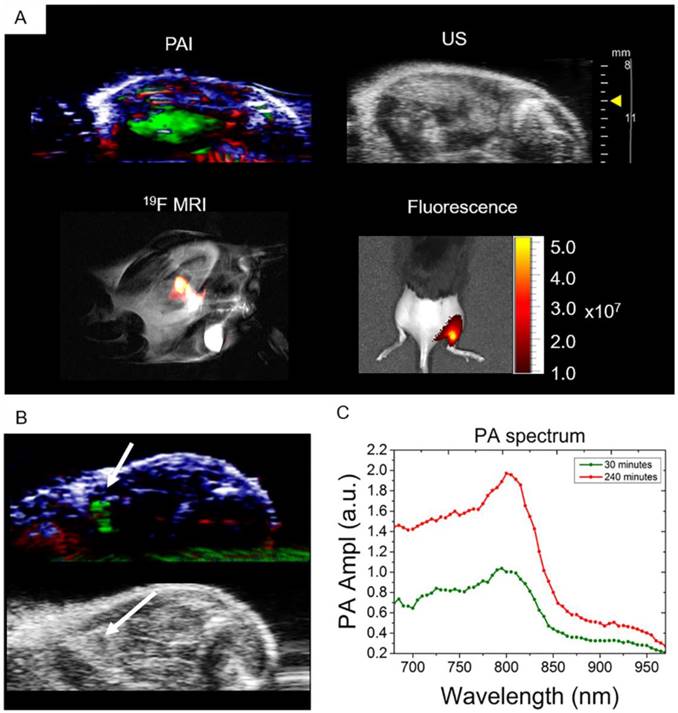
The ability to detect nanoparticles PA signal in vivo was tested with intramuscular injections of 3 mg of PFCE-ICG nanoparticles followed by imaging. The injections were done under ultrasound guidance, which allowed us to clearly visualize the administration of nanoparticles into the tissue (Video S1). After injection, we imaged the injected area first with PA, and then with fluorescence and 19F MR imaging (Fig. 3). Using PA spectroscopy with spectral unmixing, the signal from nanoparticles was extracted and separated from endogenous chromophores, such as oxy- and deoxyhemoglobin (Fig. 3A). 3D distribution of the ICG signal in the tissue, which was spread over a large area of the muscle, was also acquired (Video S2). Furthermore, we imaged the mouse with 19F MRI and, as shown in Fig. 3A, the fluorine signal (in false color) was clearly visible in the thigh muscle of the mouse, which we then superimposed over the anatomic proton scan (grayscale). 19F MRI was possible due to the high encapsulation of PFCE within nanoparticles (1.1x10¹⁹ F's/mg particles). Finally, to confirm the results from PAI and MRI, mice were imaged with fluorescence, where the radiant efficiency of the signal coming from particles was at around 1-5x10⁷ (Fig. 3A). In all cases, a clear signal from the nanoparticles was visible, demonstrating in vivo multimodal imaging.
In vivo multimodal detection of PLGA-PFCE-ICG nanoparticles. (A) Multimodal imaging (PA, US, 19F MRI and fluorescence) of PLGA-PFCE-ICG nanoparticles injected into a thigh muscle of a mouse. The signal coming from the nanoparticles is clearly detectable with all imaging modalities. (n=3) (B) Nanoparticles detection in popliteal lymph node at 4 hours' time point. (C) PLGA-PFCE-ICG nanoparticles were injected into a mouse foot pad and the popliteal lymph node was imaged 30 and 240 minutes after injection. PA signal in the node increased from 1.0 PA average amplitude at 30-minute time point to 1.97 PA average amplitude at 4-hour time point at the absorption peak.
Free nanoparticle accumulation in the draining lymph node
To demonstrate the ability of PLGA-PFCE-ICG nanoparticles to accumulate in a lymph node near the injection site, and the possibility to use these nanoparticles for cell tracking, we injected 3 mg of nanoparticles in the right footpad of a mouse. We then performed photoacoustic spectroscopy measurement of the popliteal lymph node, where we used a range of wavelengths around the ICG peak in the NIR range. Before nanoparticle administration, a PA baseline image was obtained where no lymph node was visible. 30 min after the injection of the nanoparticles, we detected the PLGA-PFCE-ICG nanoparticle signal in the popliteal lymph node (Fig 3B). With the use of automated spectral unmixing, we extracted the ICG signal in the lymph node from the surrounding tissue. The magnitude of the PA signal further increased 4 h post-injection, reflecting progressive accumulation of nanoparticles in the draining lymph node (Fig. 3C). Subsequently, we then performed a 3D scan of the tissue containing the lymph node at 4 hours to image nanoparticle distribution (Video S3).
In vivo imaging of cells loaded with PLGA-PFCE-ICG nanoparticles
The possibility to image human DCs loaded with PLGA-PFCE-ICG nanoparticles using PA was initially investigated in a gel phantom prior to in vivo imaging. 1x10⁶ nanoparticle-loaded DCs were placed in a gel phantom and imaged. Compared to free nanoparticles, we observed a broader peak at 800 nm (Fig.4B) probably due to particle internalization (Fig. 4A). It has been previously described, that in tissue and cells, the ICG emission peak is slightly shifted to longer wavelengths.24,25
In vivo multimodal imaging of cells loaded with nanoparticles. (A) Representative confocal microscopy image of DCs loaded with particles (white arrows), indicating their intracellular localization. (B) PA spectroscopy measurement in a gel phantom of nanoparticle-loaded cells (1x10⁶ cells) and free nanoparticles. (C) Different concentrations of nanoparticle-loaded cells were injected intramuscularly in vivo and imaged with PAI and fluorescence (n=3). PA data was spectrally unmixed, with green indicating the labeled cells, red oxyhemoglobin and blue deoxyhemoglobin. Furthermore, nanoparticle-loaded cells were injected into the thigh muscle and imaged with 19F MRI (n=1).
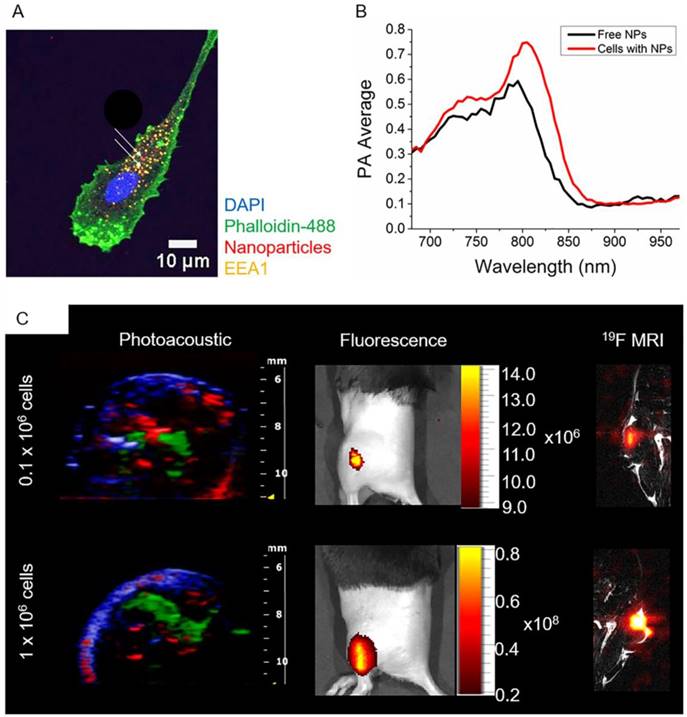
Following the phantom measurements, we injected PLGA-PFCE-ICG nanoparticle-loaded cells into a thigh muscle of a mouse and performed PA spectroscopy imaging, where we also detected the absorption peak at 800 nm (Video S4). Additionally, we examined the ability of PAI to detect a low number of nanoparticle-loaded cells by injecting cells at various concentrations (0.1x10⁶ and 1x10⁶) intramuscularly in vivo, shown in Fig. 4C. With PAI we were able to detect as little as 0.1x10⁶ nanoparticle-loaded cells, with the PA average at 0.77 (a.u.). We then confirmed the PA data with the fluorescence imaging, where we could also image all three concentrations of nanoparticle-loaded cells (Fig. 4C). 19F MRI data has been previously shown on labeled DCs with the same nanoparticles.18,19,22,26 Nevertheless, to confirm the multimodality of PLGA-PFCE-ICG nanoparticles, we also imaged 0.1x10⁶ and 1x10⁶ nanoparticle-loaded cells with 19F MRI after tissue injection (Fig. 4C).
Nanoparticle signal retention in DCs
To study the retention of the PLGA-PFCE-ICG nanoparticle signal in DCs, we incubated the cells with the label for various time points. We then measured the signal coming from the nanoparticle-loaded cells with fluorescence imaging and flow cytometry. The results of fluorescence imaging, show a clear signal of 0.7x10⁶ cells, both directly after the incubation of the cells with the label, and 24 h after further incubation in fresh medium (Fig. S1A). The first flow cytometry results show retention of the signal up to 48 h of incubation after the removal of the label (Fig. S1B), with the small decrease in the signal at day 2. In the second experiment, we incubated the cells with the label for 3 different time points. Part of the cells were incubated for additional 24 h in fresh medium. With the analysis using flow cytometer, we observed that the longer incubation of DCs with nanoparticles did not affect the signal intensity (Fig. S1C). After 24 h of additional incubation, the signal intensity of nanoparticle-positive cells slightly decreased.
Discussion
We have previously shown that PLGA-PFCE nanoparticles are suitable for cell loading, and do not affect cell properties, such as migration, maturation or functionality,18,20,22 and can be successfully used even for the simultaneous in vivo visualization of two types of primary human DC subsets using 19F MRI.19 However, given that no single imaging modality is perfect, a multimodal approach is most effective. To overcome the limitations of single imaging technique one can use an approach where a high sensitivity and a high temporal and spatial resolution modalities are combined, for example.27 Such an approach requires the use of contrast agents, which will be applicable for multiple imaging techniques.27-30 In this study, we have demonstrated the use of our nanoparticles, as a multimodal contrast agent in vivo, where the PFCE and ICG content allowed their visualization in PA, 19F MR, and fluorescence imaging.
There are several other studies focusing on the use of PFCs in a form of phase-shift droplets or nanoemulsions for US and PA imaging.31-34 The PFCs typically used in these studies are liquids with a low boiling point, which undergo a phase shift-change upon exposure to high intensity optical or acoustic pulse and produce microbubbles, resulting in an increase in imaging contrast and release of optical contrast.31 Nonetheless, despite the excellent acoustic properties, low boiling point PFC nanoemulsions are unstable for storage, and can already show the irreversible droplet-to-bubble transition upon injection.35-37 The vaporization makes them unsuitable for 19F MRI and intracellular loading. Furthermore, after phase shift, these microbubbles will dissolve quite fast precluding longitudinal imaging. Our nanoparticles encapsulate a high boiling point PFCE (145 °C) with which we do not observe any vaporization upon acoustic exposure. We also show that the encapsulation of ICG in the nanoparticles enhances ICG photostability (Fig. 2B). ICG encapsulated in nanoparticles is protected from the surrounding environment and water diffusion, which results in enhanced ICG circulatory life time, slower protein binding, and better dye stability.15,25
In general, the size of our nanoparticles should allow the particles to extravasate and accumulate in tumors via the enhanced permeability and retention (EPR) effect38,39 thanks to the cell junction gaps which typically range between 100 and 800 nm.40,41 However, in case of particles larger than 100 nm it may be necessary to further functionalize these nanoparticles with targeting moieties to avoid clearance via the reticuloendothelial system. The targeting of PLGA nanoparticles should be relatively easy and has been reviewed extensively,42,43 while functionalization and targeting of free ICG dye are difficult. After freeze-drying, PLGA-PFCE-ICG nanoparticles are stable for storage for at least several months, which makes them attractive for clinical use as they are readily accessible and easy to transport. Furthermore, the stability of PLGA-PFCE-ICG nanoparticles allows for longer imaging times, which is beneficial for in vivo cell imaging, e.g. in applications involving cell tracking.22 Both in vitro and in vivo PA measurements of nanoparticles in gel phantom showed strong contrast and a sharp absorption peak, proving that PLGA-PFCE-ICG nanoparticles can be used as contrast agents for PAI, as they can be easily distinguished from the endogenous signal of hemoglobin. Additionally, the fact that we were able to detect 19F MR signal after imaging with US and PA confirms lack of PFCE vaporization after acoustic exposure.
The detection and staging of lymph nodes, especially for the tumor draining sentinel lymph node (SLN), are of high importance for clinical cancer diagnosis and intervention. The current clinical approach to identify SLN invasively uses a colloid of radionuclide or subcutaneous injection of a dye in tissue prior to surgery.44 Fluorescent dyes are also used to stage SLN, however, they exhibit small molecular size which makes their retention in the SLN difficult. Furthermore, they pass quickly to the next node leading to difficulty in distinguishing SNL from other nodes.44 The solution to this problem lies in the use of nanoparticles with an encapsulated dye. Here, we showed the potential of using the developed nanoparticles to perform SLN staging using PAI. The experiment showed an accumulation of signal in the LN upon subcutaneous footpad injection of the nanoparticles. The signal increased over time which demonstrates a retention for a period long enough for surgery to be performed.
Current studies on PA contrast agents for cell imaging focus on the use of gold (Au) nanoparticles, Au nanorods, and single walled carbon nanotubes (SWNTs).45 For example, Au nanoparticles and nanorods have been applied for the imaging and tracking of mesenchymal stem cells in vivo.27,46 Despite their excellent optical absorption properties, SWNTs can cause long-term toxicity depending on the formulation characteristics, while Au nanoparticles can deform under photoacoustic irradiation, which leads to a shift in the optical absorption.47,48 Furthermore, the potential toxicological effects of Au nanoparticles are hard to predict.49
Our primary aim is to use PLGA-PFCE-ICG nanoparticles in cellular therapies. In this work, we focused on the imaging of primary human DCs as used in clinical vaccines. The PLGA-PFCE nanoparticles are readily taken up by DCs and typically colocalize with late endosomes.20 The nanoparticles show no toxicity and are safe for cell loading, which was shown with a standard viability assay (Fig. S2). Furthermore, we have previously shown that our nanoparticles show no side effects after in vivo injections up to 1-week post-injection.22 We have looked at the effects of the nanoparticles on labelling primary murine and human cells in several publications, and never found any significant effect.19,21,50 With the PA measurement, the absorption peak of nanoparticle-loaded cells was detected at 800 nm wavelength, which slightly differed from free nanoparticles PA peak absorption, a shift that can be caused by the cellular uptake and cellular pH.
Retention of the ICG signal is an important factor for the imaging of cellular therapies. Christensen et al. performed an experiment where they incubated free ICG dye with monocytes.51 They then looked at the changes in the fluorescent signal within the ICG-loaded cells, observing a gradual and continuous decrease in fluorescence intensity and complete loss of signal within 12 hours.51 In our signal retention experiments, we showed that the signal coming from the nanoparticle-loaded DCs can be detected at least up to 48 h. This further shows the application of PLGA-PFCE-ICG nanoparticles for longitudinal cell tracking. Overall, the results of our study show great promise for the feasible use of PLGA-PFCE-ICG nanoparticles for cell imaging and cell tracking using multimodal imaging.
Conclusion
In this work, we demonstrated the application of PLGA-PFCE-ICG nanoparticles as contrast agents in multimodal imaging, with the focus on PAI, 19F MRI, and fluorescence imaging, with a sensitivity of at least 0.1x10⁶ cells for primary human dendritic cells. The results show that our nanoparticle gives a clear signal when imaged with these imaging modalities, both in vitro and in vivo, and when loaded into cells. Furthermore, we present a reproducible method of formulation of nanoparticles, with characteristics suitable for clinical use (GMP-grade manufacturing). PLGA-PFCE-ICG nanoparticles can be potentially used as non-invasive labels for cell tracking and lymph node detection, as they do not show any toxicity after cell loading and are stable even with long incubation times with the cells. PLGA-PFCE-ICG nanoparticles can be further adapted for targeting with the addition of targeting ligands during particle synthesis. Finally, these nanoparticles are approved for a clinical cell tracking trial, making the translation for photoacoustics feasible.
Materials and Methods
Materials
Following chemicals were used: poly(D,L-lactide-co-glycolide) (PLGA) resomer RG 502H, lactide:glycolide molar ratio 50:50 (Evonik), dichloromethane (Merck, Darmstadt, Germany), perluoro-15-crown-5-ether (PFCE) (Exfluor, USA), Prohance (Bracco, Germany), poly(vinyl alcohol) (PVA, 80% hydrolized) (Sigma-Aldrich St. Louis, MO, USA), indocyanine green (IC-GREEN® for injection, USP, Akorn, USA). For cell culture X-VIVO 15 medium (Lonza, Belgium) or RPMI 1640 medium (Gibco®, Thermo Fisher, UK) was used. Ultrapure water was purified with Synergy® water purification system.
Particles synthesis
Particles were prepared using a miniemulsion synthesis technique. Briefly, PLGA (200 mg), was dissolved in 6 mL of dichloromethane, followed by the addition of 1800 μL PFCE, 2 mg of indocyanine green and 3.6 mL Prohance. The organic phase was added to 50 mL of aqueous solution of surfactant (2,5 wt.-%) and emulsified for 3 minutes with the use of probe sonicator (Q7000, microtip 6.4 mm, Qsonica LCC, USA) at 90% amplitude. Sonication was followed by overnight evaporation of solvent at room temperature. Next, the particles were collected by centrifugation, washed several times with deionized water, and then freeze-dried.
Particle characterization
Dynamic light scattering was measured on Nanotrac Flex In-situ Analyser (Microtrac, Germany) at concentrations of 0.1 mg/mL. The fluorine content of nanoparticles was measured with Nuclear Magnetic Resonance spectroscopy (Bruker Avance III 400 MHz NMR spectrometer equipped with a BBFO+ probe). The samples were prepared with 500 μL deuterium oxide (D2O) and 100 μL 0.5 vol-% trifluoroacetic acid (TFA) and transferred to NMR tubes. Data analysis was carried out with Mestrenova 10.0.2.
ICG encapsulation was measured with spectrophotometry (JASCO V-630 UV-Vis spectrophotometer). Several nanoparticle samples at a concentration of 1 mg/mL were placed in a cuvette and analyzed with the spectrophotometer, with the absorption spectrum set at 670-980 nm. Obtained data were converted to concentrations by means of calibration curves. The encapsulation efficiency was calculated using following formula:

Cryogenic Scanning Electron Microscopy was done at JEOL 6330 Cryo Field Emission Scanning Electron Microscope (FESEM). For cryo-SEM analysis, the samples (10 mg/mL, 8 µL) were pipetted in 2 rivets, which were then placed together. Next, the samples were frozen in liquid nitrogen slush and placed in an Oxford Alto 2500 cryo station with a cryo-transfer device. There the top rivet was broken and the sample was heated to -95°C for 5 minutes, followed by a coating of 60/40 Au/Pd and transfer to the Cryo-SEM.
The PA properties of nanoparticles were measured with spectroscopic PAI by scanning the excitation wavelength from 680 to 970 nm in 5 nm increments. The spectra of nanoparticles were compared to that of free dye.
Cell culture and labeling
Peripheral blood mononuclear cells (PBMCs) were isolated from buffy coats of healthy individuals after informed consent, using ficoll density centrifugation (Lymphoprep, STEMCELL Technologies, Vancouver, Canada). Adherent monocytes were cultured in X-VIVO 15 medium supplemented with 2% human serum, and in the presence of interleukin-4 (300 U/mL) and granulocyte-monocyte colony stimulating factor (450 U/mL) to obtain immature dendritic cells (DCs). Day 3 cells were harvested and labeled with nanoparticles (resuspended in PBS right before the labeling) at concentration 2 mg of nanoparticles/ 1x10⁶ cells. The cells were then incubated at 37°C in 6-well plates for several time points, based on the assay. For the in vitro and in vivo imaging sessions, the excess of the label was removed and cells were gently washed, harvested and resuspended in PBS.
Cell staining and confocal microscopy
The uptake of nanoparticles containing nile blue dye was studied with confocal microscopy. Day 3-DCs were incubated at 37°C for 24 hours on glass coverslips (20,000 cells per coverslip). After incubation the excess of the label was removed, the coverslips with attached cells were gently washed with PBS, and then the cells were fixed with 2% paraformaldehyde. Labelled cells on coverslips were permeabilized in CLSM buffer +0.1% Saponin, stained with EEA1-specific primary antibody (Ab), followed by staining with isotype-specific AlexaFluor-conjugated secondary Ab for early endosomes, phalloidin-488 for cell membrane, and DAPI for the nucleus. Stained cells were then imaged with Olympus FV1000 Confocal Laser Scanning Microscope. Acquired images were processed in the ImageJ2 program.
Signal stability test
The photoacoustic stability of the ICG signal was measured in the polyurethane tubing. Here, PLGA-PFCE-ICG nanoparticles at the concentration of 10 mg/mL were injected into the tubing. In another tubing, free ICG dye was injected. The concentration of the dye used resembled the amount of dye in the nanoparticles. Both tubes were then exposed to 10 minutes of continues photoacoustic irradiation at 800 nm. The acquired data were then plotted with the use of Origin data analysis software (Origin 9.1).
Cell viability
To investigate the influence of labelling on cell viability we performed an MTT assay. For this, 1x10⁶ cells were incubated in the presence of PLGA-PFCE-ICG nanoparticles for 72 hours. Here, two different samples were tested in triplicates, including positive and negative control. After incubation, the excess of the label was removed by gentle washing with PBS. Next, cells were collected and placed in a 96-well flat-bottom plate, washed two times with PBS (100 µL/well) with centrifugation of 2 minutes between each wash. Next, 60 µL x-vivo medium with 10 µL MTT (3-(4,5-Dimethylthiazol-2-yl)-2,5-Diphenyltetrazolium Bromide) (concentration 4 mg/mL) was added to each well, followed by 1-hour incubation at 37°C. After incubation, the plate was centrifuged for 2 minutes and 100 µL of lysis buffer (isopropanol, 10% SDS, 2N HCL, deionized water) was added to each well, and the plate was incubated for 15 minutes in dark at room temperature. Before the measurement, samples were resuspended to remove any precipitate of crystals. The plate was measured with iMark™ microplate reader (Bio-Rad, the Netherlands) at 595 nm. Cell not loaded with nanoparticles were used as negative control and cells treated with 0.2% Triton X-100 were used as a positive control.
Signal retention
In fluorescence imaging
Day-3 moDCs were labelled with PLGA-PFCE-ICG nanoparticles as described above. The cells were then incubated with the label for 72 h. At 72 h time point, the excess of the label was removed and cells were gently washed with PBS. Part of the cells (0.7x10⁶) was incubated in fresh medium without the label for additional 24 h. Remaining 0.7x10⁶ loaded cells were harvested, resuspended in 100 µL PBS and imaged with IVIS LUMINA (exc. 745 nm, exposure time 1 second). After 24 h incubation second part of the cells, was harvested, resuspended in 100 µL PBS, and imaged.
In flow cytometry
Day-3 moDCs were labelled with PLGA-PFCE-ICG nanoparticles and incubated with the label for 24, 48, and 72 h. The non-labeled cells were used here as a control. At each time point, the excess of the label was removed, the cells were gently washed with PBS, and the cells were either measured immediately or incubated further for 24 h, in fresh medium without the label. Before the measurement, the cells were harvested, washed in PBS, then resuspended in 100 µL PBA (PBS+BSA+NaN3). 10 µL of propidium iodide was added to each sample prior the measurement to label the dead cells. The cells were then measured with BD FACSVerse™ flow cytometer (BD Biosciences) to detect the PLGA-PFCE-ICG positive cells.
Imaging modalities
Photoacousitc imaging was performed on the Vevo® 2100 LAZR Imaging scanner (VisualSonics®, Inc., Toronto, Canada) equipped with an LZ250 21 MHz transducer. Fluorescent imaging was done on IVIS LUMINA in vivo imaging system with the excitation set to 745 nm and emission set to ICGreen. 19F Magnetic Resonance Imaging (MRI) was performed on 11 T MRI scanner (Biospec, Bruker, Ettlingen, Germany). Fluorine image was done using bSSFP sequence, FOV 60, matrix 32, 4 4 mm slices, TR 2.814, TE 1.407, FA 90, RF phase advance 180, 1300 averages, Power 1.2, Fre -91.8 ppm, 25 kHz bandwidth, max gain, and scan duration of 10 minutes.
In vitro clinical 19F MRI was performed on a Prisma 3 T clinical scanner (Siemens Healthcare GmbH, Erlangen, Germany), using an in-house build dual channel coil. The phantom consisted of a volume of physiological conducting fluid and a 500 mL 0,3% NaCl infusion bag, with the clinically applicable 19F phantom in between. The 19F phantom consisted of a 2 mL Eppendorf tube filled with a homogenous suspension of PLGA-PFCE-ICG nanoparticles in PBS at a 1 mg/mL concentration. Proton imaging was done with a T1-weighted 3D FLASH sequence, matrix 260x352, voxel size 0.8x0.8 mm, slice thickness 2 mm, TR 13 ms, TE 4.76 ms, flip angle 25 degrees, imaging frequency 123.236271 MHz. Fluorine imaging was done using an optimized RARE sequence; matrix 64x64, voxel size 7.8x7.8 mm, slice thickness of 1 cm, TR 4000 ms, TE 12 ms with center K-space filling, turbo factor 21, 32 averages, imaging frequency 115.946923 MHz, with a total scan duration of 6:30 min. Fluorine images where upscaled to the 1H resolution.
In vitro imaging
For the phantom experiments, nanoparticles were resuspended shortly before the measurement in PBS at various concentrations (10-150 mg/mL) and placed in wells of 8% gelatin gel phantom followed by photoacoustic imaging. Cells loaded with nanoparticles were also imaged in a gel phantom.
In vivo imaging
Wild-type C57Bl/6J female mice were obtained from Charles River Laboratory and maintained under specific pathogen-free conditions at the Central Animal Laboratory in Nijmegen, Netherlands. Experiments were performed according to the guidelines for animal care of the Nijmegen Animal Experiments Committee (DEC 2013-243).
Prior to the experiment, mice were shaved to avoid hair absorption and to facilitate the injections and imaging sessions. 40 µl of nanoparticles in PBS at concentration 100 mg/mL or 0.1 x10⁶ and 1x10⁶ cells (in 30 µl PBS) loaded with nanoparticles were injected into a mouse thigh muscle under ultrasound guidance, followed by the photoacoustic and fluorescent imaging. Furthermore, free nanoparticles and nanoparticle-loaded cells (0.1 x10⁶ and 1x10⁶) were injected intramuscularly, followed by 19F MR imaging.
Acknowledgements
Authors would like to acknowledge Andor Veltien, Sjaak van Asten and Mark van Uden for their support during 19F MRI measurements, and Visualsonics Inc. for their support with photoacoustic imaging. The MR measurements were supported by NWO Investment Grants 91106021 and BIG (VISTA). The study was supported by the European Research Council (ERC) Starting Grant (CoNQUeST Grant no. 336454) and grant 14716 from the Netherlands organization for scientific research NWO-TTW to MS. IJMdV received an NWO-Vici 918.14.655.
Author Contributions
The manuscript was written through contributions of all authors. All authors have given approval to the final version of the manuscript.
Supplementary Material
Video S1.
Video S2.
Video S3.
Video S4.
Supplementary figures.
Competing Interests
The authors have declared that no competing interest exists.
References
1. Wang LV, Hu S. Photoacoustic Tomography: In Vivo Imaging from Organelles to Organs. Science. 2012;335:1458-1462
2. Beard P. Biomedical Photoacoustic Imaging. Interface Focus. 2011;1:602-631
3. Lutzweiler C, Razansky D. Optoacoustic Imaging and Tomography: Reconstruction Approaches and Outstanding Challenges in Image Performance and Quantification. Sensors (Switzerland). 2013;13:7345-7384
4. Ermolayev V, Dean-Ben XL, Mandal S. et al. Simultaneous Visualization of Tumour Oxygenation, Neovascularization and Contrast Agent Perfusion by Real-Time Three-Dimensional Optoacoustic Tomography. Eur Radiol. 2016;26:1843-1851
5. Neuschmelting V, Lockau H, Ntziachristos V. et al. Lymph Node Micrometastases and In-Transit Metastases from Melanoma: In Vivo Detection with Multispectral Optoacoustic Imaging in a Mouse Model. Radiology. 2016;280:137-150
6. Manohar S, Vaartjes SE, van Hespen JCG. et al. Initial Results of in Vivo Non-Invasive Cancer Imaging in the Human Breast Using near-Infrared Photoacoustics. Opt Express. 2007;15:12277-12285
7. van den Berg PJ, Daoudi K. et al. Feasibility of Photoacoustic/Ultrasound Imaging of Synovitis in Finger Joints Using a Point-of-Care System. Photoacoustics. 2017;8:8-14
8. Kim C, Erpelding TN, Maslov K. et al. Handheld Array-Based Photoacoustic Probe for Guiding Needle Biopsy of Sentinel Lymph Nodes. J Biomed Opt. 2010;15:046010
9. Mallidi S, Larson T, Tam J. et al. Multiwavelength Photoacoustic Imaging and Plasmon Resonance Coupling of Gold Nanoparticles for Selective Detection of Cancer. Nano Lett. 2009;9:2825-2831
10. Zhang Y, Hong H, Cai W. Photoacoustic Imaging. Cold Spring Harb Protoc. 2011. 2011
11. Weber J, Beard PC, Bohndiek SE. Contrast Agents for Molecular Photoacoustic Imaging. Nat Methods. 2016;13:639-650
12. Wu D, Huang L, Jiang MS, Jiang H. Contrast Agents for Photoacoustic and Thermoacoustic Imaging: A Review. Int J Mol Sci. 2014;15:23616-23639
13. Lyu Y, Zeng J, Jiang Y. et al. Enhancing Both Biodegradability and Efficacy of Semiconducting Polymer Nanoparticles for Photoacoustic Imaging and Photothermal Therapy. ACS Nano. 2018;12:1801-1810
14. Jiang Y, Upputuri PK, Xie C. et al. Broadband Absorbing Semiconducting Polymer Nanoparticles for Photoacoustic Imaging in Second Near-Infrared Window. Nano Lett. 2017;17:4964-4969
15. Ferrauto G, Carniato F, Di Gregorio E. et al. Large Photoacoustic Effect Enhancement for ICG Confined inside MCM-41 Mesoporous Silica Nanoparticles. Nanoscale. 2017;9:99-103
16. Hannah A, Luke G, Wilson K. et al. Indocyanine Green-Loaded Photoacoustic Nanodroplets: Dual Contrast Nanoconstructs for Enhanced Photoacoustic and Ultrasound Imaging. ACS Nano. 2014;8:250-259
17. Swider E, Srinivas M. Spinning to a Different Beat: 19F Agents for “Hot-Spot” Cellular MR Imaging. Design and Applications of Nanoparticles in Biomedical Imaging. Springer International Publishing: Cham. 2017:153-170
18. Srinivas M, Heerschap A, Ahrens ET, Figdor CG, de Vries IJM. (19)F MRI for Quantitative in Vivo Cell Tracking. Trends Biotechnol. 2010;28(7):363-370
19. Srinivas M, Tel J, Schreibelt G. et al. PLGA-Encapsulated Perfluorocarbon Nanoparticles for Simultaneous Visualization of Distinct Cell Populations by 19F MRI. Nanomedicine (Lond). 2015;10:2339-2348
20. Swider E, Staal AHJ, Riessen NK. et al. Design of Triphasic Poly(Lactic-Co-Glycolic Acid) Nanoparticles Containing a Perfluorocarbon Phase for Biomedical Applications. RSC Adv. 2018;8:6460-6470
21. Cruz LJ, Tacken PJ, Zeelenberg IS. et al. Tracking Targeted Bimodal Nanovaccines: Immune Responses and Routing in Cells, Tissue, and Whole Organism. Mol Pharm. 2014;11:4299-4313
22. Srinivas M, Cruz LJ, Bonetto F. et al. Customizable, Multi-Functional Fluorocarbon Nanoparticles for Quantitative in Vivo Imaging Using 19F MRI and Optical Imaging. Biomaterials. 2010;31:7070-7077
23. Yuan B, Chen N, Zhu Q. Emission and Absorption Properties of Indocyanine Green in Intralipid Solution. J Biomed Opt. 2004;9:497-503
24. Porcu EP, Salis A, Gavini E. et al. Indocyanine Green Delivery Systems for Tumour Detection and Treatments. Biotechnol Adv. 2016;34:768-789
25. Desmettre T, Devoisselle JM, Mordon S. Fluorescence Properties and Metabolic Features of Indocyanine Green (ICG) as Related to Angiography. Surv Ophthalmol. 2000;45:15-27
26. Srinivas M, Boehm-Sturm P, Aswendt M. et al. In Vivo 19F MRI for Cell Tracking. J Vis Exp. 2013;81:e50802
27. Nam SY, Ricles LM, Suggs LJ, Emelianov SY. In Vivo Ultrasound and Photoacoustic Monitoring of Mesenchymal Stem Cells Labeled with Gold Nanotracers. PLoS One. 2012;7:e37267
28. Reguera J, Jiménez de Aberasturi D, Henriksen-Lacey M. et al. Janus Plasmonic-Magnetic Gold-Iron Oxide Nanoparticles as Contrast Agents for Multimodal Imaging. Nanoscale. 2017;9:9467-9480
29. Osseni SA, Lechevallier S, Verelst M. et al. Gadolinium Oxysulfide Nanoparticles as Multimodal Imaging Agents for T 2 -Weighted MR, X-Ray Tomography and Photoluminescence. Nanoscale. 2014;6:555-564
30. Sharma P, Singh A, Brown SC. et al. Multimodal Nanoparticulate Bioimaging Contrast Agents. Methods in molecular biology. Clifton, N.J. 2010:67-81
31. Li DS, Yoon SJ, Pelivanov I. et al. Polypyrrole-Coated Perfluorocarbon Nanoemulsions as a Sono-Photoacoustic Contrast Agent. Nano Lett. 2017;17:6184-6194
32. Fernandes DA, Fernandes DD, Li Y. et al. Synthesis of Stable Multifunctional Perfluorocarbon Nanoemulsions for Cancer Therapy and Imaging. Langmuir. 2016;32:10870-10880
33. Niu C, Wang L, Wang Z. et al. Laser Irradiated Fluorescent Perfluorocarbon Microparticles in 2-D and 3-D Breast Cancer Cell Models. Sci Rep. 2017;7:43408
34. Niu C, Xu Y, An S. et al. Near-Infrared Induced Phase-Shifted ICG/Fe3O4 Loaded PLGA Nanoparticles for Photothermal Tumor Ablation. Sci Rep. 2017;7:5490
35. Rapoport N, Nam KH, Gupta R. et al. Ultrasound-Mediated Tumor Imaging and Nanotherapy Using Drug Loaded, Block Copolymer Stabilized Perfluorocarbon Nanoemulsions. J Control Release. 2011;153:4-15
36. Strohm E, Rui M, Gorelikov I. et al. Vaporization of Perfluorocarbon Droplets Using Optical Irradiation. Biomed Opt Express. 2011;2:1432
37. Wilson K, Homan K, Emelianov S. Biomedical Photoacoustics beyond Thermal Expansion Using Triggered Nanodroplet Vaporization for Contrast-Enhanced Imaging. Nat Commun. 2012;3:618
38. Chen J, Wu Q, Luo L. et al. Dual Tumor-Targeted Poly(Lactic-<em>co</Em>-Glycolic Acid)-polyethylene Glycol-folic Acid Nanoparticles: A Novel Biodegradable Nanocarrier for Secure and Efficient Antitumor Drug Delivery. Int J Nanomedicine. 2017;12:5745-5760
39. Karri VVSR, Dhandapani NV, Mannemala SS. et al. Ameliorating the Antitumor Activity of Lenalidomide Using PLGA Nanoparticles for the Treatment of Multiple Myeloma. Braz J Pharm Sci. 2017;53:2
40. Prabhakar U, Maeda H, Jain RK. et al. Challenges and Key Considerations of the Enhanced Permeability and Retention Effect for Nanomedicine Drug Delivery in Oncology. Cancer Res. 2013;73:2412-2417
41. Wilson KE, Wang TY, Willmann JK. Acoustic and Photoacoustic Molecular Imaging of Cancer. J Nucl Med. 2013;54:1851-1854
42. Mahapatro A, Singh DK. Biodegradable Nanoparticles Are Excellent Vehicle for Site Directed In-Vivo Delivery of Drugs and Vaccines. J Nanobiotechnology. 2011;9:55
43. Sharma S, Parmar A, Kori S, Sandhir R. PLGA-Based Nanoparticles: A New Paradigm in Biomedical Applications. TrAC Trends Anal Chem. 2015;80:30-40
44. Akers WJ, Kim C, Berezin M. et al. Noninvasive Photoacoustic and Fluorescence Sentinel Lymph Node Identification Using Dye-Loaded Perfluorocarbon Nanoparticles. ACS Nano. 2011;5:173-182
45. Wang Y, Xu C, Ow H. Commercial Nanoparticles for Stem Cell Labeling and Tracking. Theranostics. 2013;3:544-560
46. Jokerst JV, Thangaraj M, Kempen PJ. et al. Photoacoustic Imaging of Mesenchymal Stem Cells in Living Mice via Silica-Coated Gold Nanorods. ACS Nano. 2012;6:5920-5930
47. Link S, Burda C, Nikoobakht B. et al. Laser-Induced Shape Changes of Colloidal Gold Nanorods Using Femtosecond and Nanosecond Laser Pulses. J Psych Chem B. 2000;104:6152-6163
48. Liu Y, Zhao Y, Sun B, Chen C. Understanding the Toxicity of Carbon Nanotubes. Acc Chem Res. 2013;46:702-713
49. Gerber A, Bundschuh M, Klingelhofer D, Groneberg DA. Gold Nanoparticles: Recent Aspects for Human Toxicology. J Occup Med Toxicol. 2013;8:32
50. Bonetto F, Srinivas M, Weigelin B. et al. A Large-Scale (19)F MRI-Based Cell Migration Assay to Optimize Cell Therapy. NMR Biomed. 2012;25:1095-1103
51. Christensen JM, Brat GA, Johnson KE. et al. Monocytes Loaded with Indocyanine Green as Active Homing Contrast Agents Permit Optical Differentiation of Infectious and Non-Infectious Inflammation. PLoS One. 2013;8:1-7
Author contact
![]() Corresponding author: mangala.srinivasnl
Corresponding author: mangala.srinivasnl