- Volume 10; 2026
- Volume 9; 2025
- Volume 8; 2024
- Volume 7; 2023
- Volume 6; 2022
- Archive
- Editorial Board
- Cover Suggestion
- Index & Coverage
- Special Issues
Introduction
Results
Discussion
Conclusion
Experimental Section
Acknowledgements
Supplementary Material
References
International Journal of Biological Sciences
International Journal of Medical Sciences

 Global reach, higher impact
Nanotheranostics 2018; 2(4):306-319. doi:10.7150/ntno.26389 This issue Cite
Research Paper
Ferumoxytol-based Dual-modality Imaging Probe for Detection of Stem Cell Transplant Rejection
Kai Li1,2,†,‡, Carmel T. Chan1,†, Hossein Nejadnik1,†, ![]() , Olga D. Lenkov1, Cody Wolterman1, Ramasamy Paulmurugan1, Huaxiao Yang3, Sanjiv Sam Gambhir1, Heike E. Daldrup-Link1,
, Olga D. Lenkov1, Cody Wolterman1, Ramasamy Paulmurugan1, Huaxiao Yang3, Sanjiv Sam Gambhir1, Heike E. Daldrup-Link1, ![]()
1. Department of Radiology and Molecular Imaging Program at Stanford (MIPS), Stanford School of Medicine, Stanford, CA 94305, USA
2. Institute of Materials Research and Engineering, A*STAR, Singapore 138634, Republic of Singapore
3. Stanford Cardiovascular Institute, Stanford, CA 94305, USA
†These authors contributed equally to this work
‡Current address of Kai Li is Department of Biomedical Engineering, Southern University of Science and Technology, Shenzhen, Guangdong 510855, China.
Received 2018-4-1; Accepted 2018-6-14; Published 2018-6-23
Abstract

Purpose: Stem cell transplants are an effective approach to repair large bone defects. However, comprehensive techniques to monitor the fate of transplanted stem cells in vivo are lacking. Such strategies would enable corrective interventions at an early stage and greatly benefit the development of more successful tissue regeneration approaches. In this study, we designed and synthesized a dual-modality imaging probe (Feru-AFC) that can simultaneously localize transplanted stem cells and diagnose immune rejection-induced apoptosis at an early stage in vivo.
Methods: We used a customized caspase-3 cleavable peptide-dye conjugate to modify the surface of clinically approved ferumoxytol nanoparticles (NPs) to generate the dual-modality imaging probe with fluorescence “light-up” feature. We labeled both mouse mesenchymal stem cells (mMSCs, matched) and pig mesenchymal stem cells (pMSCs, mismatched) with the probe and transplanted the labeled cells with biocompatible scaffold at the calvarial defects in mice. We then employed intravital microscopy (IVM) and magnetic resonance imaging (MRI) to investigate the localization, engraftment, and viability of matched and mismatched stem cells, followed by histological analyses to evaluate the results obtained from in vivo studies.
Results: The Feru-AFC NPs showed good cellular uptake efficiency in the presence of lipofectin without cytotoxicity to mMSCs and pMSCs. The fluorescence of Feru-AFC NPs was turned on inside apoptotic cells due to the cleavage of peptide by activated caspase-3 and subsequent release of fluorescence dye molecules. Upon transplantation at the calvarial defects in mice, the intense fluorescence from the cleaved Feru-AFC NPs in apoptotic pMSCs was observed with a concomitant decrease in the overall cell number from days 1 to 6. In contrast, the Feru-AFC NP-treated mMSCs exhibited minimum fluorescence and the cell number also remained similar. Furthermore, in vivo MRI of the Feru-AFC NP-treated mMSC and pMSCs transplants could clearly indicate the localization of matched and mismatched cells, respectively.
Conclusions: We successfully developed a dual-modality imaging probe for evaluation of the localization and viability of transplanted stem cells in mouse calvarial defects. Using ferumoxytol NPs as the platform, our Feru-AFC NPs are superparamagnetic and display a fluorescence “light-up” signature upon exposure to activated caspase-3. The results show that the probe is a promising tool for long-term stem cell tracking through MRI and early diagnosis of immune rejection-induced apoptosis through longitudinal fluorescence imaging.
Keywords: stem cell, apoptosis, magnetic resonance imaging, molecular imaging, calvarial defect, intravital microscopy imaging
Introduction
Bone injuries, which often do not heal without significant medical intervention,1,2 are debilitating to individuals and costly to our society. Yet, successfully repairing large bone defects still represents a major clinical challenge. Compared to bone allografts, stem cell transplants possess many advantages, such as high tissue regeneration potential, immediate availability, potentially unlimited quantities, and better engraftment outcomes.3-5 However, due to histocompatibility antigen differences, the host immune system can recognize and attack allogeneic adult stem cells,6-9 embryonic stem cell-derived progenitors,10-14 and autologous induced pluripotent stem cells,15,16 triggering rejection. Although the use of allogeneic stem cells or third party ("off the shelf") transplants is commonly advocated,17-23 a non-invasive diagnostic approach for in vivo detection of stem cell rejection is still needed to detect transplant failure at an early stage for corrective interventions.
To achieve optimal outcomes of stem cell therapies, a comprehensive understanding of their cell fate is critical (i.e., localization, engraftment, and viability). Magnetic resonance (MR) imaging (MRI) can provide a three-dimensional view of the transplant site to monitor the location of stem cells and apoptosis.24 However, the small signal changes in MR relaxivity between viable and apoptotic cells restrict the sensitivity of its application for detecting cell apoptosis to a relatively late stage (14 days). Although several optical imaging techniques (e.g., fluorescence and bioluminescence) have been developed to monitor the earliest occurrence of cell apoptosis, these methods provide limited anatomical information. Additionally, bioluminescence imaging requires the injection of a large amount of substrate, which restricts its translational applications.
The purpose of our study was to develop a probe that could both localize transplanted stem cells and diagnose rejection-induced apoptosis in a real-time manner in vivo. We designed and synthesized a novel dual-modality imaging probe, called Feru-AFC, that is composed of an iron oxide (IO) backbone and a peptide-linked caspase-3-activatable fluorescent probe. To facilitate the translational potential of this probe, we used the superparamagnetic ferumoxytol IO core, which has been approved for anemia treatment by the U.S. Food and Drug Administration and is used “off label” as a contrast agent for MRI applications.25 Using a ferumoxytol nanoparticle (NP) as the carrier, we can feasibly deliver the new light-up probe for real-time cell apoptosis imaging. We reasoned that we could use this new probe to locate stem cells based on T2-shortening effects in MR images and diagnose immune rejection-induced stem cell apoptosis based on an increase in AFC fluorescence signals on real-time optical scanning using intravital microscopy (IVM). We previously used IVM imaging to longitudinally monitor the homing of rhodamine-conjugated ferumoxytol-labeled mouse macrophages toward transplanted human mesenchymal stem cells (MSCs) during immune rejection in a calvarial defect in mice.26 In this study, we used IVM imaging to monitor apoptosis of mismatched pig MSCs (pMSCs) during immune rejection at an early stage using the same mouse model with mouse MSCs (mMSCs) as the matched control. Our results suggest that the dual-modality probe is a promising tool for long-term stem cell tracking and early diagnosis of immune rejection-induced apoptosis.
Results
Synthesis and Characterization of Caspase-3-activatable Dual-modality Probes
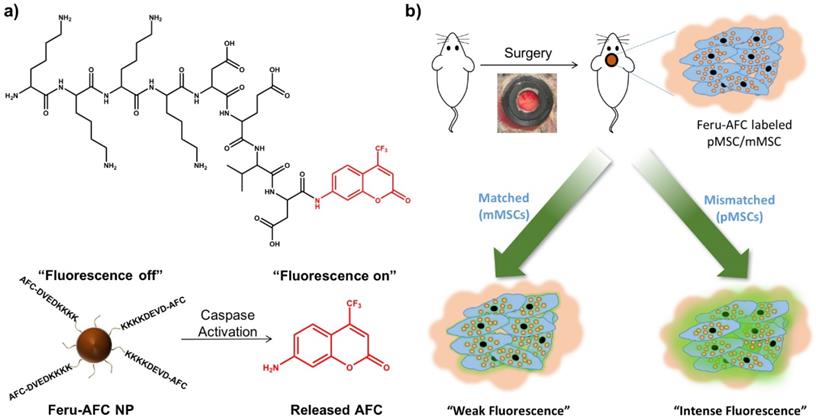
We aimed to develop a dual-modality probe to ultimately label matched and mismatched MSCs to monitor the kinetics of immune rejection in regenerative medicine. To do so, we used a customized DEVD-containing, caspase-3-cleavable peptide (KKKKDEVD-AFC) to modify the surface of ferumoxytol NPs. In brief, we treated ferumoxytol with sodium hydroxide and chloroacetic acid for carboxylation of the surface hydroxyl groups. To functionalize the carboxylated ferumoxytol NPs with KKKKDEVD-AFC, we performed a 1-ethyl-3-(3-dimethylaminopropyl)-carbodiimide (EDAC)-coupling reaction. Figure 1 shows the chemical structure of the peptide and the fluorescence response of our resulting Feru-AFC NPs in the presence of activated caspase-3.
Design and mechanism of a caspase-3-cleavable probe with fluorescence “light-up” signature based on ferumoxytol NPs. (a) The chemical structure of the activated caspase-3-cleavable peptide, KKKKDEVD-AFC, and the schematic illustration of the fluorescence response of Feru-AFC NPs to activated caspase-3. The Feru-AFC NPs remain in an “off” state when the peptide is intact. In the presence of activated caspase-3, DEVD is cleaved to release AFC molecules (“on” state) from ferumoxytol with intense fluorescence that can be detected in a FITC channel at an emission maximum at 495 nm. (b) Schematic illustration of the in vivo evaluation of activated caspase-3-cleavable Feru-AFC NPs. The recipient mice received calvarial defects, followed by transplantation of mMSCs (matched) or pMSCs (mismatched) labeled with Feru-AFC NPs and seeded in polyethylene glycol (PEG)-based scaffolds. Apoptosis of mismatched pMSCs by immune rejection activates the cleavage of the peptide for increased fluorescence signal upon laser excitation.
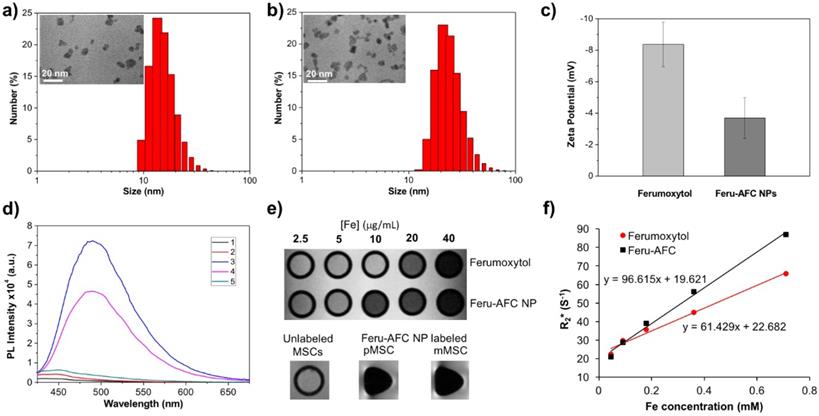
Upon further characterization, we determined that the average hydrodynamic diameter of the Feru-AFC NPs was 25.33 ± 1.70 nm with a narrow size distribution (Figures 2a and 2b), larger than that of the ferumoxytol NPs without functionalization (16.14 ± 0.98 nm) (p < 0.05). Transmission electron microscopy revealed that the iron oxide cores of the Feru-AFC NPs were roughly spherical and the diameters ranged from 7 to 10 nm. In addition, we confirmed the successful conjugation of the positively charged peptides on the NP surface by examining the zeta potential of Feru-AFC NPs in phosphate buffered saline (PBS): the zeta potential was less negative than that of unmodified ferumoxytol NPs (-8.37 ± -1.42 mV versus -3.69 ± -1.29 mV; p < 0.05; Figure 2c). The average number of peptides conjugated on each ferumoxytol particle was estimated to be ~150, as described in the Supplementary Information.
Characterization of Feru-AFC NPs. (a) Size distribution and transmission electron microscopy results of ferumoxytol NPs and (b) Feru-AFC NPs. (c) Zeta potential of ferumoxytol and Feru-AFC NPs in 1× PBS buffer, measured by a Zetasizer Nano ZS (p < 0.05). (d) Fluorescence intensity of Feru-AFC NPs ([Fe] = 150 μg/mL) with or without active caspase-3 in different solutions. Combinations included: (1) Feru-AFC NPs in deionized (DI) water; (2) Feru-AFC NPs in assay buffer; (3) Feru-AFC NPs and recombinant caspase-3 in assay buffer; (4) Feru-AFC NPs and apoptotic pMSCs extract in assay buffer; and (5) Feru-AFC NPs and viable pMSCs extract in assay buffer. Very weak fluorescence was observed for intact Feru-AFC NP solutions but strong fluorescence was detected upon caspase-3 cleavage. (e) T2-weighted MR images of ferumoxytol and Feru-AFC NPs at various Fe concentrations in water. Lower panels show T2-weighted MR images of MSCs (3 million cells in 50 μL of Dulbecco's modified Eagle's medium, DMEM) with or without labeling by Feru-AFC NPs at 37ºC for 24 h (p < 0.05). (f) T2* relaxation rate (1/T2) of ferumoxytol and Feru-AFC NPs versus Fe concentration in water (p < 0.01). The slope is r2* relaxivity.
In Vitro Evaluation of Caspase-3-activatable Dual-modality Probes
We next evaluated the changes in fluorescence signals of Feru-AFC NPs upon exposure to activated caspase-3 in vitro. Figure 2d shows that Feru-AFC NPs remained non-emissive in the green fluorescence range in either water or assay buffer at 37°C. However, after incubation with recombinant human activated caspase-3 under the same experimental conditions, we observed a strong fluorescence signal with an emission peak at 495 nm in the Feru-AFC NP solution. To evaluate the fluorescence response of Feru-AFC NPs to activated intracellular caspase-3, we used mitomycin C (MMC) to induce apoptosis of pMSCs. Upon incubation with the apoptotic cell lysates, the fluorescence intensity at 495 nm from the Feru-AFC NP solution significantly increased by >12 fold. On the contrary, the extract from viable pMSCs did not lead to an obvious increase in fluorescence signals.
We measured the transverse relaxation times (T2*) of the Feru-AFC NPs to verify their utility for MRI. Figures 2e and 2f show the T2-weighted MR image of both ferumoxytol and Feru-AFC NP aqueous suspensions at different iron concentrations. The signal intensity of the MR image decreased with increased iron concentration, indicating that the NPs were able to shorten the transverse relaxation time. The net effectiveness is expressed as T2* relaxivity (r2*), which represents the reciprocal of the relaxation time per unit concentration. As shown in Figure 2f, the Feru-AFC NPs had an r2* value of 96.615 mM-1 s-1, which was significantly higher than that of ferumoxytol NPs without functionalization (61.429 mM-1 s-1) (p < 0.05). We examined the in vitro potential of Feru-AFC NPs for MRI by testing the contrast effect in MSCs. The MR images of MSCs post incubation with Feru-AFC NPs compared to non-labeled MSCs showed an obvious enhanced contrast by ~13-fold (Figure 2e, p < 0.05), due to the shortened transverse relaxation time of cells after Feru-AFC NP labeling to produce a negative contrast in MRI. Additionally, the T2* relaxation time was shorter in mMSCs than in pMSCs, indicating a higher iron concentration and hence uptake of Feru-AFC NPs.
To study the cytotoxicity of Feru-AFC NPs, we incubated them with pMSCs and mMSCs for 24 hours at different iron concentrations (Figure 3a). A tetrazolium reduction-based cell viability assay showed that Feru-AFC NPs alone had negligible cytotoxicity to both pMSCs and mMSCs at an iron concentration of 400 μg/mL. However, the viability of both pMSCs and mMSCs dropped significantly when the iron concentration reached 200 μg/mL with lipofectin as the transfection reagent, suggesting that lipofectin is cytotoxic at high concentrations. We further investigated the uptake efficiency of Feru-AFC NPs by mMSCs and pMSCs using a Prussian blue staining assay to visualize the intracellular accumulation of iron. As shown in Figure 3b, nearly 100% of both pMSCs and mMSCs were positive for Prussian blue staining upon labeling with Feru-AFC NPs at 100 μg/mL of iron with lipofectin. We confirmed this result using ICP-MS, by which we detected significantly higher intracellular iron concentrations in NP-treated mMSCs (~8.1 pg/cell) compared to pMSCs (~3.9 pg/cell) (p < 0.05).
In vitro analysis of Feru-AFC NPs at a cellular level. (a) Cell viability results from a tetrazolium reduction based cell viability assay: pMSCs were incubated with Feru-AFC NPs with lipofectin (black) or without lipofectin (red) for 24 hours at different iron concentrations. After washing, the cells were incubated with fresh medium for another 48 hours before undergoing the cell viability assay. The relative cell viability is expressed by the ratio of readings from sample wells to control wells. (b) Prussian blue staining of mMSCs and pMSCs labeled by Feru-AFC NPs. The MSCs were incubated with Feru-AFC NPs at a final Fe concentration of 100 μg/mL with lipofectin as a transfection reagent for 24 hours before undergoing Prussian blue staining. (c) Osteogenic differentiation assay. Both mMSCs and pMSCs were labeled with Feru-AFC NPs and then incubated with osteogenic differentiation medium for 14 days. The differentiation medium was changed every other day. Alizarin Red S staining was performed to monitor calcium depositions. (d) Fluorescence imaging of apoptotic Feru-AFC NP-labeled pMSCs.
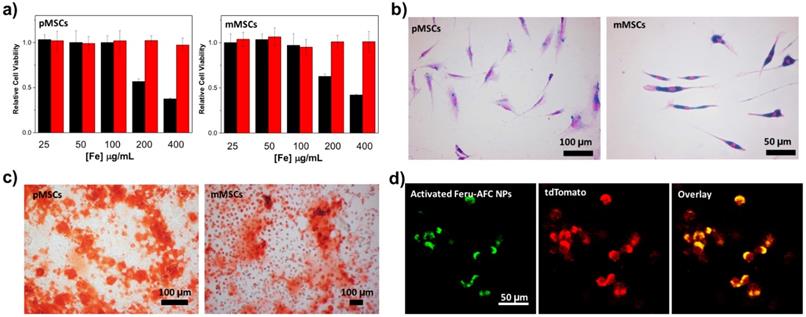
In practice, the ideal exogenous labeling probes should have minimal perturbation to the differentiation of MSCs.27 Bone marrow-derived stem cells are able to undergo osteogenic differentiation both in vitro and in vivo. Therefore, we studied the osteogenic differentiation potential of pMSCs and mMSCs post Feru-AFC NP labeling upon incubation in osteogenic induction medium for 14 days. We investigated calcium deposition by alizarin red S staining and found significant mineralization in both pMSCs and mMSCs (Figure 3c) compared to cells without incubation in osteogenic differentiation medium. These results clearly indicate that the labeling of Feru-AFC NPs does not affect the osteogenic differentiation potential of pMSCs and mMSCs.
Using ferumoxytol NPs as a “Trojan Horse”, we successfully delivered the living cell non-permeable peptide (KKKKDEVD-AFC) into the cytoplasm of MSCs after incubation in culture medium. To test the fluorescence response of Feru-AFC NPs in apoptotic pMSCs, we treated the Feru-AFC NP-labeled pMSCs (expressed with td-Tomato) with MMC to induce apoptosis. We embedded the apoptotic cells in a polyethylene glycol (PEG) scaffold for imaging using IVM to mimic an in vivo animal study. We were able to detect strong green fluorescence from the apoptotic cells through the FITC channel, and red signal (td-Tomato) showing the cell morphologies through the TRITC channel (Figure 3d). Further, we performed live cell imaging in a real-time manner to monitor the intracellular fluorescence change during the apoptosis process (Supplementary Figure S1). At the starting time point (0 min), the cells labeled with Feru-AFC NPs exhibited no green fluorescence because there was not enough activated intracellular caspase-3 in viable MSCs. Upon addition of staurosporine (1 μM), the cells underwent apoptosis and the green fluorescence in the FITC channel increased in the cell cytoplasm over time. These results suggest that the fluorescence “light-up” probes work well in both solution and cells.
In Vivo Detection of Immune Rejection-induced Apoptosis of Pig MSCs
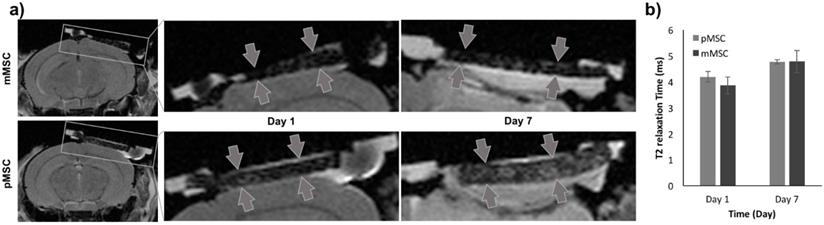
To evaluate the Feru-AFC NPs in vivo, we delivered them into mMSCs (matched) and pMSCs (mismatched) before transplanting them into female C57BL/6J mice with calvarial defects (n = 6). We used MRI to localize the Feru-AFC-treated mMSCs and pMSCs seeded in the scaffold (Figure 4a). In vivo MRI of the Feru-AFC NP-treated mMSC and pMSC transplants did not reveal any significant differences in T2 relaxation time at days 1 and 7 after implantation (p = 0.43 and p = 0.98, respectively) (Figure 4b).
MRI to localize implanted Feru-AFC-labeled mMSCs and pMSCs in mouse calvarial defects. (a) Representative images from MRI of mouse (matched) and pig (mismatched) MSCs transplants (arrows) in calvarial defects, 1 and 7 days after implantation. (b) Corresponding quantitative analysis from MRI of matched and mismatched MSCs in calvarial defects (p > 0.05 for pMSCs versus mMSCs on days 1 and 7).
To longitudinally monitor the immune rejection of pMSCs in vivo, we performed IVM imaging at different time points (days 1, 3, and 6) post transplantation of Feru-AFC NP-treated mMSCs and pMSCs. We used pMSCs labeled with td-Tomato and mMSCs labeled with CellBrite Red to allow visualization of the transplanted cells in the TRICT and Cy5 channels, respectively. The majority of the pMSCs showed fluorescence signals in both the FITC and TRITC channels (Figure 5a, right panel), indicating apoptosis. Consistently, the overall number of pMSCs decreased from days 1 to 6 (Figure 5a). In contrast, the mMSCs exhibited CellBrite signals in the Cy5 channel only (Figure 5b, right panel), and the number of mMSCs remained negligible change (Figure 5b). From IVM study, we could identify a single dead cell through green fluorescence channel from the activated Feru-AFC. (Supplementary Figure S3). To further confirm that the fluorescence signals were higher in the FITC channel for pMSCs (Figure 5a, middle panel) versus mMSCs (Figure 5b, middle panel), we performed single cell volumetric analyses using the TRITC channel for selection of pMSCs (n=4) and the Cy5 channel for selection of mMSCs (n=2) (Figure 5c) at all time points (p < 0.05).
Longitudinal IVM imaging of apoptosis of transplanted pMSCs and mMSCs in vivo. (a) Td-Tomato-labeled pMSCs showed strong fluorescence signal in the FITC channel, representing apoptosis; fluorescence in the TRITC channel decreased from days 1-6. (b) CellBrite Red™-labeled mMSCs showed minimal signal in the FITC channel; fluorescence levels in the Cy5 channel appeared unchanged from days 1-6. (c) Three-dimensional volumetric analyses showed that the sum fluorescence intensity in the FITC channel was higher for pMSCs than mMSCs (* indicates p < 0.05). (d) Embedding of Feru-AFC-labeled pMSCs or mMSCs in the scaffold did not trigger activation of the Feru-AFC NP probe.
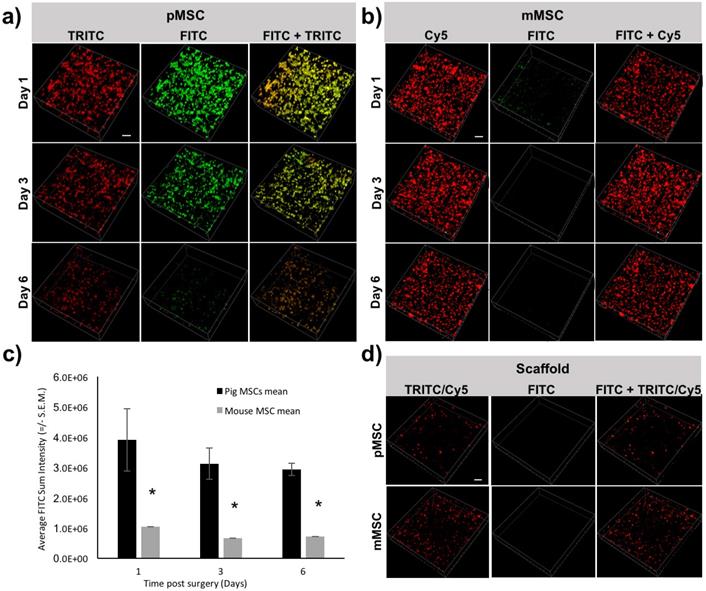
To confirm that the embedding of the MSCs in the scaffold did not trigger apoptosis at the time of implantation, we imaged the scaffold with Feru-AFC NP-labeled pMSCs and mMSCs. In both cases, we used the FITC channel for detection of apoptotic cells. As shown in Figure 5d, we did not detect apoptotic cells with either mMSCs or pMSCs embedded in the scaffold.
To validate the MRI results for the presence of Feru-AFC NPs within the scaffold, we performed DAB-Prussian blue on immune-mismatched pMSCs (Figure 6b) and matched mMSCs (Figure 6i) implants. In accordance with the MRI results, the number of Feru-AFC NPs was similar in the scaffold embedded with mMSCs versus pMSCs.
Immunohistochemistry and immunofluorescence staining of stem cell apoptosis and macrophage infiltration in calvarial defects of mice transplanted with Feru-AFC NP-labeled pMSCs (left panel) and mMSCs (right panel). (a, h) Hematoxylin and eosin (H&E) staining of the tissue sections shows the scaffold embedded with pMSCs or mMSCs above the brain. (b, i) Prussian blue staining shows the presence of Feru-AFC NPs within the scaffold (black arrowheads). (c, j) Higher levels of activated caspase-3 (brown stain) were detected in pMSCs compared to mMSCs (black arrowheads). (d, k) Immunofluorescence staining shows higher levels of activated caspase-3 (red) in pMSCs compared to mMSCs (white arrowheads). DAPI was used to counterstain for the nucleus (blue). (e, l) Higher amounts of mouse macrophage (CD68, brown) infiltration was detected in the scaffold embedded with pMSCs (black arrowheads) versus mMSCs. (f, m) Immunofluorescence staining shows higher amounts of mouse macrophage (CD68, red) infiltration for in the scaffold embedded with pMSCs (white arrows) versus mMSCs. Feru-AFC NPs were detected by staining for dextran (green). DAPI was used to counterstain for the nucleus (blue). (g, n) H&E staining (4× stitched images) of the scaffold seeded with labeled pMSCs (left panel) and mMSCs (right panel). The scale bar in each panel represents 50 µm.
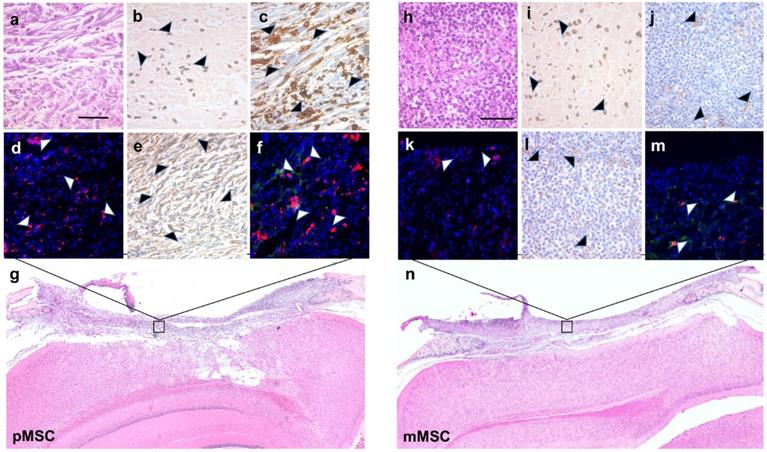
To correlate the IVM signals for the FITC channel with activation of caspase-3 and subsequent infiltration of macrophages, we performed IHC and IF on the adjacent tissue sections. Staining for activated caspase-3 confirmed a higher number of apoptotic cells (Figures 6c and 6d versus Figures 6j and 6k) and an increased infiltration of macrophages (Figures 6e and 6f versus Figure 6l and 6m) in immune-mismatched pMSCs, compared to matched mMSCs.
Discussion
Stem cell therapies have emerged as promising treatments for serious diseases that are incurable by traditional medical approaches, including bone regeneration, cancer, diabetes, myocardial infarction, and Alzheimer's disease et al.28-35 Our data shows that the dual-modality imaging probe Feru-AFC can be used to both localize transplanted stem cells and diagnose early stage immune rejection-induced stem cell apoptosis in vivo. The high r2* relaxivity and caspase-3-activated fluorescence profile of Feru-AFC NPs enabled in vivo real-time monitoring of their localization and the immune rejection-induced apoptotic process in mismatched pMSCs transplants through non-invasive MRI and IVM imaging. This new imaging biomarker could facilitate non-invasive prediction of stem cell survival and engraftment, allowing optimization of stem cell therapies for bone regeneration.
To realize the full therapeutic potential of transplanted cells, we need to comprehensively evaluate and understand their fate in order to use non-invasive cell labeling techniques to distinguish the localization and viability of implanted cells over a reasonable observation period.36-38 Bioluminescent reporter genes (e.g., luciferase) are commonly used to address the distribution and viability of transplanted cells with high sensitivity and simplicity,39 but genetic modification, which could potentially alter the cell fate, may hinder clinical translation. Several types of radiotracers for single-photon emission computed tomography or positron emission tomography imaging, such as 123I-, 99mTc-, and 18F-labeled annexin V, have been used for in vivo detection of cell apoptosis.40,41 Although the radiotracers afford good sensitivity, they are unable to provide sufficient anatomical resolution for in vivo imaging, and radiation exposure is a concern for repetitive imaging. Alternatively, optical imaging techniques have been extensively used for the detection of different stages in cell apoptosis. For instance, fluorescent dye-labeled synaptotagmin C2A domain42 and annexin V43 have been developed to recognize phosphatidylserine in apoptotic cells, but they were later found to give false signals due to the presence of phosphatidylserine in the outer leaflets of non-apoptotic cells.44 These optical probes usually rely on intravenous injection to facilitate specific binding to apoptotic cell membranes at the target sites; however, clearance issues may result in non-specific binding to surrounding tissues. More importantly, optical imaging has not been established for clinical applications because it suffers from insufficient anatomical resolution and tissue penetration depth.45
By contrast, as a non-ionizing and non-radioactive imaging technique MRI boasts the desired anatomical resolution to promote clinical translation.46 Our group has monitored the relaxivity change of a Gd-based caspase-3-responsive MRI probe at the transplantation site to identify apoptosis of transplanted MSCs in cartilage defects.47 Although the application of the activatable MRI probe for cell apoptosis detection was promising, the potential toxicity of free Gd and the possible intracranial deposition after imaging may lead to safety concerns.48 We have also demonstrated that ferumoxytol-labeled NPs can be used to differentiate engraftment outcomes between day 14 post-transplantation viable and apoptotic human MSCs (hMSCs) based on the faster clearance of iron oxides in apoptotic hMSCs transplants. By imaging macrophage migration during phagocytosis of iron-labeled apoptotic hMSCs, this study provided valuable information about the late stages of cell apoptosis. However, immune rejection occurs very early after post transplantation, so it is important to monitor apoptosis at the earliest time points.
In this study, we further modified the ferumoxytol NPs using activated caspase-3-cleavable peptides to enhance r2* relaxivity and induce a fluorescence “light-up” profile in apoptotic cells. Although DEVD-AFC-based peptides have been evaluated for caspase-3 activity in solution using purified enzyme, this is the first study to attach them onto iron oxide NPs to facilitate their application intracellularly. The Feru-AFC NPs showed high labeling efficiency and no toxicity to MSCs under the test conditions (Figure 3a), and our probe showed negligible impact on the osteogenic differentiation of pMSCs and mMSCs (Figure 3c). Several important parameters, including the effect of protein corona, cell sex, and cell source may affect nanoparticle uptake by cells and interfere with the labeling capacity of iron oxide nanoparticles.49-51 However, to prevent the potential interference from these factors, we used Lipofectin as a transfection agent to shuttle the nanoparticles into cells. We hypothesize that the immobilization of peptides on the Feru-AFC NPs creates a hydrophilic peptide layer on the NP surface that restricts fast water diffusion and promotes fast proton exchange with water molecules due to abundant surface amides.52 This enhanced the water diffusion correlation time, leading to a significant increase of r2* relaxivity, which will be beneficial for in vivo MRI with higher resolution and sensitivity. Our evaluation of the fluorescence “light-up” signature in solution, in vitro cell culture, and in vivo transplantation confirmed the sensitivity of the NPs in the presence of activated caspase-3. The prompt response of Feru-AFC NPs-labeled pMSCs to intracellular activated caspase-3 allowed us to track the immune rejection within a day of transplantation (Figure 5). Even though, we do not have an independent measurement of caspase-3, a) the DEVD sequence which is present in the cleavable peptide (KKKKDEVD-AFC) in our Feru-AFC NPs (Figure 1) has been characterized by multiple investigators to be specific for caspase-3; b) time-lapse microscopy (Supplementary Figure S1) and IVM (Supplementary Figure S3A) showed the typical cell morphology associated with apoptosis. One of the significant challenge in transplantation field is the early graft failure due to non-immunogenic events (such as cell damage during the procedure, etc.). While our probe is specific for detection of caspase-3 activation during apoptosis, it cannot differentiate between cell death due to immune vs. non-immune events, which is a limitation of our current study and future extension for rescue intervention during transplantation. Experimentally, to distinguish the two mechanisms, we could potentially treat the mice that are transplanted with pig MSCs with immunosuppressant drugs (e.g. rapamycin) and perform IVM to estimate the fraction of cells that undergoing apoptosis due to non-immune events. However, this extensive study is beyond the scope of our current study.
While in vivo MRI enabled localization of cell transplants in skull defects on day 1, we did not observe significant signal differences between the matched (mMSCs) and mismatched (pMSCs) implants at day 7 post transplantation (Figure 4). In accordance with other studies,53 we showed that the iron oxide signal on MR images could persist after the death of labeled cells; this may be due to slow iron metabolism, macrophage/microglial behaviors, and/or our short follow-up period. The carboxymethyldextran is cleaved by dextranase and excreted by the kidneys. The iron core is incorporated into the bodies iron store and slowly metabolized over time. The T2-signal is not linearly related to iron concentration. The initially high local iron concentration at the transplant site likely decreased over time, but not enough to change the T2-value within the first 7 days. There is a possibility that the released irons are engulfed in the local macrophages and get degraded slowly.
Since our study uses a window chamber-based mouse model, the green fluorescence from the activated probe in calvarial defects above the brain could be feasibly detected by IVM. Thus, our approach has the advantage of monitoring the engraftment and viability of transplanted MSCs directly by MRI and IVM with high sensitivity. As ferumoxytol has shown excellent safety profiles over numerous clinical trials during the past two decades, our Feru-AFC NPs hold great potential for clinical translation. In future studies, we will develop a caspase-3-responsive peptide that could be coupled with a near-infrared fluorescent dye to facilitate deeper tissue penetration and lower background autofluorescence. Likewise, a hand-held fluorescence detection device could be co-implanted for detection of apoptotic signals in deeper locations and success of transplant engraftment post-surgery in different disease models.
Conclusion
In summary, we developed a clinically translatable, dual-modality imaging probe for in vivo tracking and detection of immune rejection-induced stem cell death. Our novel probe could help to stratify patients with signs of immune rejection to anti-inflammatory or immunosuppressive therapies, and those without signs of immune responses could be spared from these interventions. Our probe could be also utilized to examine the choice of different stem cell types, scaffolds, growth factors, and immune response modifiers on stem cell engraftment outcomes. This could in turn inform the exploration of more successful bone regeneration approaches via the development of new classes of anti-inflammatory and pro-regenerative drugs. Finally, this study advances the new field of stem cell-mediated bone repair and evaluation of bone allograft apoptosis.
Experimental Section
Materials
For ferumoxytol, we used a commercial product from AMAG Pharmaceuticals, Inc. (Waltham, MA, USA). KKKKDEVD-AFC peptide was customized by GL Biochem Ltd. (Shanghai, China). DMEM, fetal bovine serum (FBS), LipofectinTM transfection reagent, and penicillin-streptomycin (pen-strep) solution were provided by Thermo Fisher Scientific (Waltham, MA, USA). MMC, chloroacetic acid, hydrochloride acid, sodium hydroxide, EDAC, and N-hydroxysulfosuccinimide sodium salt (sulfo-NHS) were purchased from Sigma-Aldrich (St. Louis, MO, USA). Dialysis tubing (MWCO 12-14k Da and MWCO 3500 Da) was a product from Spectrum Laboratories. Amicon Ultra-4 Centrifugal filter units were obtained from EMD Millipore (Temecula, CA, USA).
Synthesis of Feru-AFC NPs
To achieve carboxylation of ferumoxytol, ferumoxytol solution (500 μL, 30 mg/mL) was mixed with sodium hydroxide (3 M) and chloroacetic acid (1 M) in a 10 mL aqueous solution under vigorous stirring overnight at room temperature. The carboxylated ferumoxytol NPs were then purified using MWCO 3.5kD dialysis tubing against DI water for two days.
To further conjugate peptide on the carboxylated ferumoxytol surface, EDAC (0.1 mmol) and sulfo-NHS (0.1 mmol) were added to the carboxylated ferumoxytol solution under vigorous stirring for 4 h at room temperature. After centrifugation to remove excess EDAC and sulfo-NHS, KKKKDEVD-AFC peptides (0.02 mmol) were added to the activated ferumoxytol solution for 2 h at room temperature. The mixture was then purified using an Amicon Ultra-4 Centrifugal filter unit with an Ultracel-10 membrane to eliminate excess peptides. Upon dialysis against DI water using MWCO 12-14kD dialysis tubing for 2 days, the synthesized Feru-AFC NPs were collected and stored at 4°C for further use. The iron concentration of Feru-AFC NP stock solution was measured using ICP-MS.
Characterization of Feru-AFC NPs
To determine the sizes and zeta potential values of ferumoxytol and Feru-AFC NPs, the samples in 1× PBS solutions at an Fe concentration of 50 μg/mL were analyzed using Zetasizer Nano ZS equipment. Each sample was analyzed in triplicate.
To determine the morphology of ferumoxytol and Feru-AFC NPs, the NPs were studied by transmission electron microscopy. In brief, 10 uL of each solution was pipetted onto a carbon film-coated copper grid. After 3 min, the solution was wicked away with filter paper and the grid was put under a lamp to obtain the dried sample. Imaging was performed using JEOL JEM1400 transmission electron microscopy.
To determine the relaxivity of ferumoxytol and Feru-AFC NPs, in vitro MRI studies were conducted on a 7 Tesla MRI Bruker ClinScan using a wrist coil. The transverse relaxation times (T2*) of ferumoxytol and Feru-AFC NPs in water with various Fe concentrations (0, 2.5, 5, 10, 20, 40 μg/mL) were measured individually using a spin echo sequence with a repetition time of 2000 ms and multiple echo times of 6, 13, 20, 27, 34, and 40 ms. The T2* relaxivity values (r2*) was obtained from linear least-squares determination of the slope of 1/T2* relaxation rate (s-1) versus the Fe concentration plot.
Cell Culture
To obtain pMSCs, bone marrow aspiration was performed on 6-8-month-old female Göttingen minipigs (Marshall BioResources) under anesthesia. The obtained bone marrow was mixed with DMEM medium at a volume ratio of 1:6. After centrifugation at 2500 rpm for 20 min, the supernatant was discarded and the cell pellet was mixed with DMEM for centrifugation again. The cell pellet was dispersed in full culture medium of DMEM (10% FBS and 1% pen-strep) and seeded in T175 flasks for incubation at 37°C with 5% CO2 in an incubator. After 4-5 days, the cells were washed with 1× PBS buffer and fresh culture medium was added. The medium was replaced every three days until cells reached confluence for subculture or preservation. The pMSCs were transfected with a plasmid encoding td-Tomato that is driven by the ubiquitin promoter. Fluorescence-activated cell sorting was used to create a pure population of transduced cells by separating td-Tomato-expressing cells.
To obtain mMSCs, bone marrow aspiration was performed on 6-8-week-old female C57BL/6J (Jackson Laboratory) mice.54 Mice were euthanized by CO2 inhalation and both femurs and tibias were isolated. Upon removal of epiphyses, the bone marrow was flushed with DMEM/F12 with Glutamax™, supplemented with 10% FBS. The bone marrows were washed through centrifugation at 1500 rpm for 10 min and re-suspended in 10 mL of 1× PBS. The cell pellet was collected after another round of centrifugation and re-suspended in full culture medium supplemented with 10% PBS, 1% pen-strep, and 50 pg/mL of human fibroblastic growth factor. The cell dispersion was plated in a T75 flask and maintained at 37°C with 5% CO2 for 5-7 days. The medium was replaced every three days or when the cells reached confluence. Non-adherent hematopoietic stem cells, red blood cells, and white blood cells were eliminated during changes of culture medium, leaving the adherent MSCs.
Cytotoxicity of Feru-AFC NPs
To investigate the cytotoxicity of Feru-AFC NPs, a novel tetrazolium-based cell viability assay [CellTiter 96® AQueous One Solution Cell Proliferation Assay (MTS), Promega] was employed to study the cell viability after incubation with Feru-AFC NPs at different Fe concentrations. Culture media with different Fe concentrations were prepared as follows: 50 μL of Feru-AFC NPs ([Fe] = 20 mg/mL) were diluted in 100 μL of pure DMEM, and lipofectin (100 μL) was mixed with 100 μL of pure DMEM. After 10 min, the prepared Feru-AFC NP solution was mixed with lipofectin solution and set for 15 min, followed by dilution into full culture medium supplemented with 10% FBS and 1% pen-strep to reach a final Fe concentration of 400 μg/mL. The stock solution was further diluted with full culture medium to achieve Fe concentrations of 200, 100, 50, and 25 µg/mL. A total of 5 × 10³ of pMSCs or mMSCs were seeded on a 96-well plate. After 48 h recovery, 100 µL of culture medium with Feru-AFC NPs at Fe concentrations of 400, 200, 100, 50, and 25 µg/mL in each well were used for incubation with the cells in the presence of lipofectin for 24 hours. The old culture medium was discarded and fresh culture medium was added for a further incubation of 48 hours. Then, 20 µL of MTS solution was added into each well, and the absolute intensities of absorbance at 490 nm were recorded by a microplate reader (Bioteck) after 1 h of incubation in the cell culture incubator. Cell viability was expressed as the ratio of absorbance of cells treated with NPs to that of cells without NP treatment. Each group of varied Feru-AFC NP concentrations had six replicates.
Cellular Uptake of Feru-AFC NPs
To visualize the internalization of Feru-AFC NPs into MSCs, the pMSCs and mMSCs were incubated with Feru-AFC NPs in the presence of lipofectin at an Fe concentration of 100 µg/mL for 24 hours. The cells were washed twice with 1×PBS buffer and then stained with the Accustain Prussian blue kit (Sigma Aldrich, St. Louis, MO, USA) for comparison under microscopy. To quantify the Fe concentration in MSCs, 1 million of the as-labeled pMSCs and mMSCs were dissolved in 0.5 mL of 26% hydrochloric acid and diluted in 4.5 mL of MilliQ water for ICP-MS analysis. Each sample was analyzed in triplicate and the Fe content was calculated using a standard curve with an ICP-MS standard.
Effect of Feru-AFC NPs on Osteogenic Differentiation of MSCs
To evaluate the osteogenic potential of the Feru-AFC NP-treated pMSCs and mMSCs in vitro, the calcium deposits were investigated by alizarin red S staining. Cells were seeded on a 24-well plate with 5,000 pMSCs/well and 10,000 mMSCs/well. The cells were then labeled by Feru-AFC NPs in the presence of lipofectin at a Fe concentration of 100 µg/mL for 24 hours. The labeling medium was then discarded and replaced by osteogenic differentiation medium, consisting of low-glucose DMEM supplemented with 10% FBS (Gibco), 100 U/ml penicillin, 100 µg/ml streptomycin (Gibco), 10% L-glutamine (Gibco), 50 µg/ml L-ascorbic acid 2-phosphate sequimagnesium (Sigma), 100 µg/ml sodium pyruvate (Gibco), 0.1 µM dexamethasone (Sigma, St Louis, MO), and 100mM β-glycerophosphate. The osteogenic medium was changed every other day for 14 days. The cells were then washed with PBS buffer and fixed in 10% neutral buffered formalin for 15 min at room temperature. After washing with PBS, the fixed cells were stained with alizarine red S (Sigma) for 5 min and the reaction was stopped with DI water. The cells were further washed with DI water until the solution turned clear. Images were then taken using a microscope.
Fluorescence Response of Feru-AFC NPs to Activated Caspase-3 in Solution
In a pilot study, we tested the fluorescence response of Feru-AFC NPs in the presence of either caspase-3 extract from apoptotic pMSCs or recombinant human caspase-3.
To induce MSC apoptosis, pMSCs were treated with 0.5 mg/mL of MMC solution in DMEM for 1 hour at 37°C. The cells were then washed twice with 1×PBS buffer and further cultured in complete DMEM supplemented with 10% FBS and 1% pen-strep for another 24 hours at 37°C. After being treated with 1× trypsin, the cell pallet was collected through centrifugation and dispersed in 1× cell lysis buffer (AnaSpec, Inc.). The cell suspension (5 million cells) was placed on a rotating apparatus for 30 min at 4°C, followed by centrifugation at 2500g for 10 min. The supernatant containing activated caspase-3 was then collected and stored at -80°C for further use. Extract from viable pMSCs without treatment of MMC was also prepared according to the same procedure using cell lysis buffer.
In the fluorescence response experiments using cell extract, 50 μL of Feru-AFC NPs (300 μg/mL of Fe) in assay buffer (AnaSpec, Inc., Fremont, CA, USA) was mixed with 50 μL of apoptotic pMSC extract or viable pMSC extract in a well of a 96-well plate. The mixtures were incubated at 37ºC for 12 hours and the fluorescence spectrum was recorded with 400 nm excitation using a BioTek microplate reader. Recombinant human caspase-3 was also used to monitor the fluorescence change. Feru-AFC NPs (300 μg/mL of Fe) in assay buffer (50 μL) was mixed with 50 μL of DI water, followed by the addition of 0.1 μg of recombinant human caspase-3 (R&D System, Minneapolis, MN) for 2 hours at 37ºC. No recombinant human caspase-3 was added in the control group. The mixtures were incubated at 37ºC for 2 hours and the fluorescence spectrum was recorded with 400 nm excitation using a BioTek microplate reader (Winooski, VT).
In Vitro Fluorescence Response of Feru-AFC NPs in MSCs
To study the fluorescence response of Feru-AFC NPs in apoptotic pMSCs, 1 million pMSCs were cultured in a T75 culture flask and incubated with Feru-AFC NPs at an Fe concentration of 100 µg/mL for 24 hours. The cells were then incubated with 0.5 mg/mL MMC for 1 hour at 37ºC, followed by incubation in fresh medium for 24 hours to induce apoptosis. All floating cells were collected and the adherent cells were detached by trypsin. After centrifugation, the pMSCs were embedded in PEG scaffold for imaging using IVM. The FITC and TRITC channels were used for collection of fluorescence signals from activated Feru-AFC NPs and td-Tomato.
The fluorescence “light-up” feature of Feru-AFC NPs in cells was also studied using live cell imaging. MSCs were seeded in an 8-well chamber slide at 5,000 cells/well and cultured in DMEM supplemented with 10% FBS and 1% pen-strep at 37°C. Feru-AFC NPs were incubated with cells at an Fe concentration of 100 μg/mL with lipofectin as the transfection reagent for 24 hours. The cell monolayers were washed twice with 1×PBS buffer to eliminate excess NPs and lipofectin. The chamber was put on a fluorescence microscopy stage for live cell imaging. Upon replacement of the medium with DMEM containing 1 μM staurosporine, the fluorescence images of the cells in the FITC channel were recorded at designated time points to track the fluorescence change during cell apoptosis.
In Vivo Imaging of MSC Apoptosis in Calvarial Defects
All animal procedures were performed in accordance with approved protocols by the Stanford's Administrative Panel on Laboratory Animal Care. To understand the fate of MSCs in vivo, we designed a mouse model for integrated IVM imaging and MRI studies of immune responses to the matched and mismatched transplanted stem cells. A calvarial defect with a 5-mm diameter was created in 8-week-old female C57BL/6J mice (Jackson Laboratory, Sacramento, CA) under anesthesia with 2% isofluorane delivered in 100% oxygen. A total of 5 × 10⁵ Feru-AFC NP-treated pMSCs embedded in a PEG dimethacrylate (PEGDA) scaffold that was catalyzed by ammonium persulfate and N,N,N',N'-tetramethylethylenediamine were transplanted into the defect (n = 6). For the matched group, we labeled the membrane of 5 × 10⁵ Feru-AFC NP-treated mMSCs using CellBrite™ red (Biotium, Freemont, CA) following the manufacturer's instructions. The cells were then mixed with PEGDA scaffold and transplanted into the defects, similar to the pMSCs (n = 2).
IVM imaging was performed on anesthetized mice using the Nikon A1+ system (Melville, NY). Mouse heads were immobilized using a stereotactic frame coupled with ear bars (Kopf Instruments, Tujunga, CA). To detect the presence of live td-Tomato-labeled pMSCs and CellBrite™ red-labeled mMSCs within the scaffold, the TRITC and Cy5 channels were used, respectively. To detect the presence of apoptotic cells within the scaffold, the FITC channel was used. Sequential IVM imaging was performed on days 1, 3, and 6 post MSC transplantation. Large image Z-tiles (3 × 3 tiles with 512 × 512 pixels each; 920.5 µm each in x and y directions) between 200 and 300 µm in Z-height at a 1 µm step size were acquired at two random, non-overlapping positions for each time point for each mouse. To confirm the scaffold did not induce apoptosis of mMSCs and pMSCs, IVM imaging was also performed on separate scaffolds embedded on the same day as surgery.
Three-dimensional volumetric image analyses were performed for individual cells using the Nikon NIS-Elements software. The same volumetric thresholds were applied to all the large Z-tiles for both FITC (apoptotic) and TRITC/Cy5 (live MSCs) channels. The parameters that were quantitated were a) sum intensity, which is the sum of all pixel intensity in the Z-tile; b) mean intensity [sum (pixel intensity) / number of pixels in the large Z = tiles]; and c) volume of the cells (µm3). To estimate the extent of apoptosis in each cell, a ratio of FITC/(TRITC or Cy5) was calculated for each cell in each position for each mouse at each time point. Results were expressed as mean +/- standard error of mean.
To study the MRI signal changes in vivo, all MSC transplants post surgery were scanned on a 7T MR scanner with a T2-weighted spin echo sequence (echo times, TE = 40 ms, repetition time, TR = 3000 ms and number of averages, NEX = 4) and multi-echo spin echo sequence (echo time, TE = 7, 13, 20, 27, 34, 40 ms, repetition time, TR = 2000 ms and number of excitations, NEX = 1) at 1 and 7 days post surgery. T2 relaxation times were calculated using ParaVision® software (Bruker BioSpin Corp.).
Histological Analyses of the Skull Graft
After the last MRI scans, mice were sacrificed and defects were explanted and placed in an Optimal Cutting Temperature compound (Thermo Fisher Scientific, Hampton, NH, USA) on dry ice for histological processing. Samples were cut into 5 µm slides and warmed to room temperature, followed by fixation in a 50% ice-cold acetone/50% methanol mixture. For iron nanoparticle staining, DAB-Prussian blue with the Accustain Iron Stain kit (Sigma-Aldrich, St. Louis, MO, USA) and a Pararosaniline solution counterstain was performed. For fluorescent staining, samples were washed in PBS, and blocked with V block (Fisher Scientific, Chicago, IL) for 5 min, followed by overnight incubation at 4ºC with antibodies. Antibody dilutions were as following: 1:50 for Alexa594-conjugated rabbit anti-activated human/mouse caspase-3 (clone D3E9, Cell Signaling Technology, Danvers, MA) and 1:200 for mouse anti-rat CD68 that cross-reacts with mouse CD68 (Clone ED1, Abcam, Cambridge, MA). Samples were then washed three times with PBS with 0.1% Tween. For CD68 staining, post primary antibody slides were incubated with Alexa647 goat-anti-mouse (1:200) for 30 min at room temperature, followed by three additional washes with PBS with 0.1% Tween. All slides were washed once with PBS prior to the addition of ProLong Gold Antifade Mountant (Thermo Fisher Scientific, Hampton, NH, USA) and mounting of coverslips. Slides were stored out of direct light. Images for fluorescence staining of activated caspase-3 and CD68 were captured at 20× using an AxioImager Widefield Fluorescence microscope.
Statistical Analyses
Data from different groups were analyzed by the student's t-test and differences at the 95% confidence level (p < 0.05) were considered to be statistically significant.
Quantitative MRI and IVM data of MSC transplants were tested for significant differences over time utilizing a mixed linear model with a random effect for each mouse calvarial defect. Differences between matched and mismatched MSC transplants were tested with a t-test. P-values of less than 0.05 were considered statistically significant.
Acknowledgements
This work was supported by NIH grant #R01AR054458 from the National Institute of Arthritis and Musculoskeletal and Skin Diseases and a grant from the Musculoskeletal Transplant Foundation. Kai Li is grateful for the financial support of A*STAR International Fellowship and the Thousand Young Talents Program. Cody Wolterman is supported by a stipend from the California Institute for Regenerative Medicine. We thank Drs. Jolien S. Tyler and Brian Magolin from Nikon Instruments for help with IVM image acquisition and data analyses. We also thank Mr. David Russel for set up and maintenance of the Stanford Intravital Microscopy Imaging Facility. †These authors (K. Li, C. T. Chan, H. Nejadnik) contributed equally to this work.
Ethics Committee Approval
All animal procedures were performed in accordance with approved protocols by the Stanford's Administrative Panel on Laboratory Animal Care.
Author Contributions
H.E.D. and S.S.G. supervised the project. K.L., C.T.C., and H.N. designed the project. K.L. synthesized the probe. K.L., C.T.C., and H.N. performed the in vitro and in vivo experiments. H.N. conducted the surgery. R.P. provided td-Tomato-labeled pig MSCs. O.L. performed in vivo MRI studies. O.L. and C.W. performed histological analyses. K.L., C.T.C., H.N., and O.L. wrote the manuscript. All authors revised the manuscript.
Supplementary Material
Supplementary methods and figures.
Competing Interests
The authors have declared that no competing interest exists.
References
1. Ciapetti G, Granchi D, Baldini N. The combined use of mesenchymal stromal cells and scaffolds for bone repair. Curr Pharm Des. 2012;18:1796-820
2. Chimutengwende-Gordon M, Khan WS. Advances in the use of stem cells and tissue engineering applications in bone repair. Curr Stem Cell Res Ther. 2012;7:122-6
3. Brooks PM. Impact of osteoarthritis on individuals and society: how much disability? Social consequences and health economic implications. Curr Opin Rheumatol. 2002;14:573-7
4. Wan D, Chen D, Li K, Qu Y, Sun K, Tao K. et al. Gold nanoparticles as a potential cellular probe for tracking of stem cells in bone regeneration using dual-energy computed tomography. ACS Appl Mater Interfaces. 2016;8:32241-9
5. Wu Y, Chen L, Scott PG, Tredget EE. Mesenchymal stem cells enhance wound healing through differentiation and angiogenesis. Stem Cells. 2007;25:2648-59
6. Yang XF. Immunology of stem cells and cancer stem cells. Cell Mol Immunol. 2007;4:161-71
7. O'Sullivan ES, Vegas A, Anderson DG, Weir GC. Immunology of stem cells and cancer stem cells. Endocr Rev. 2011;32:827-44
8. Preynat-Seauve O, Krause KH. Stem cell sources for regenerative medicine: the immunological point of view. Semin. Immunopathol. 2011:33 519-24
9. Zangi L, Margalit R, Reich-Zeliger S, Bachar-Lustig E, Beilhack A, Negrin R. et al. Direct imaging of immune rejection and memory induction by allogeneic mesenchymal stromal cells. Stem Cells. 2009;27:2865-74
10. English K, Wood KJ. Immunogenicity of embryonic stem cell-derived progenitors after transplantation. Curr Opin Organ Transplant. 2011;16:90-5
11. Swijnenburg RJ, Tanaka M, Vogel H, Baker J, Kofidis T, Gunawan F. et al. Embryonic stem cell immunogenicity increases upon differentiation after transplantation into ischemic myocardium. Circulation. 2005;112:I166-I172
12. Thompson HL, Manilay JO. Embryonic stem cell-derived hematopoietic stem cells: challenges in development, differentiation, and immunogenicity. Curr Top Med Chem. 2011;11:1621-37
13. Swijnenburg RJ, van der Bogt KE, Sheikh AY, Cao F, Wu JC. Clinical hurdles for the transplantation of cardiomyocytes derived from human embryonic stem cells: role of molecular imaging. Curr Opin Biotechnol. 2007;18:38-45
14. van der Bogt KE, Swijnenburg RJ, Cao F, Wu JC. Molecular imaging of human embryonic stem cells: keeping an eye on differentiation, tumorigenicity and immunogenicity. Cell Cycle. 2006;5:2748-52
15. Boyd AS, Rodrigues NP, Lui KO, Fu X, Xu Y. Concise review: Immune recognition of induced pluripotent stem cells. Stem Cells. 2012;30:797-803
16. Zhao T, Zhang ZN, Rong Z, Xu Y. Immunogenicity of induced pluripotent stem cells. Nature. 2011;474:212-5
17. Charron D, Suberbielle-Boissel C, Al-Daccak R. Immunogenicity and allogenicity: a challenge of stem cell therapy. J Cardiovasc Transl Res. 2009;2:130-8
18. Ciapetti G, Granchi D, Baldini N. The combined use of mesenchymal stromal cells and scaffolds for bone repair. Curr Pharm Design. 2012;18:1796-820
19. Jorgensen C, Noel D. Mesenchymal stem cells in osteoarticular diseases. Regen Med. 2011;6:44-51
20. Chimutengwende-Gordon M, Khan WS. Advances in the use of stem cells and tissue engineering applications in bone repair. Curr Stem Cell Res. Ther. 2012;7:122-6
21. Zhang ZY, Teoh SH, Hui JH, Fisk NM, Choolani M, Chan JK. The potential of human fetal mesenchymal stem cells for off-the-shelf bone tissue engineering application. Biomaterials. 2012;33:2656-72
22. Sherman LS, Munoz J, Patel SA, Dave MA, Paige I, Rameshwar P. Moving from the laboratory bench to patients' bedside: considerations for effective therapy with stem cells. Clin Transl Sci. 2011;4:380-6
23. Polak JM, Mantalaris S. Stem cells bioprocessing: an important milestone to move regenerative medicine research into the clinical arena. Pediatr Res. 2008;63:461-6
24. Nejadnik H, Lenkov O, Gassert F, Fretwell D, Lam I, Daldrup-Link HE. Macrophage phagocytosis alters the MRI signal of ferumoxytol-labeled mesenchymal stromal cells in cartilage defects. Sci Rep. 2016;6:25897
25. Castaneda RT, Khurana A, Khan R, Daldrup-Link HE. Labeling stem cells with ferumoxytol, an FDA-approved iron oxide nanoparticle. J Vis Exp. 2011;57:e3482
26. Daldrup-Link H. E, Chan C, Lenkov O, Taghavigarmestani S, Nazekati T, Chapelin F, et al. Detection of stem cell transplant rejection with ferumoxytol MR imaging: correlation of MR imaging findings with those at intravital microscopy. Radiology. 2017;284:495-507
27. Jin G, Mao D, Cai P, Liu R, Tomczak N, Liu J. et al. Conjugated polymer nanodots as ultrastable long-term trackers to understand mesenchymal stem cell therapy in skin regeneration. Adv Funct Mater. 2015;25:4263-73
28. Marin-Garcia J, Goldenthal MJ. Application of stem cells in cardiology: where we are and where we are going. Curr Stem Cell Res Ther. 2006;1:1-11
29. Pardal R, Clarke MF, Morrison SJ. Applying the principles of stem-cell biology to cancer. Nat Rev Cancer. 2003;3:895-902
30. Pileggi A. Mesenchymal stem cells for the treatment of diabetes. Diabetes. 2012;61:1355-6
31. Grayson WL, Bunnell BA, Martin E, Frazier T, Hung BP, Gimble JM. Stromal cells and stem cells in clinical bone regeneration. Nat Rev Endocrinol. 2015;11:140-50
32. Mahmoudi M, Tachibana A, Goldstone AB, Woo YJ, Chakraborty P, Lee KR. et al. Novel MRI contrast agent from magnetotactic bacteria enables in vivo tracking of iPSC-derived cardiomyocytes. Sci Rep. 2016;6:26960
33. Hofmann M, Wollert KC, Meyer GP, Menke A, Arseniev L, Hertenstein B. et al. Monitoring of bone marrow cell homing into the infarcted human myocardium. Circulation. 2005;111:2198-202
34. Wang J, Jokerst JV, Stem cell imaging. tools to improve cell delivery and viability. Stem Cells International. 2016;2016:9240652.35
35. Chen F, Ma M, Wang J, Wang F, Chern SX, Zhao ER. Exosome-like silica nanoparticles: a novel ultrasound contrast agent for stem cell imaging. Nanoscale. 2017;9:402-11
36. Ding D, Mao D, Li K, Wang X, Qin W, Liu R. et al. Precise and long-term tracking of adipose-derived stem cells and their regenerative capacity via superb bright and stable organic nanodots. ACS Nano. 2014;8:12620-31
37. Xu C, Miranda-Nieves D, Ankrum JA, Matthiesen ME, Phillips JA, Roes I. et al. Tracking mesenchymal stem cells with iron oxide nanoparticle loaded poly(lactide-co-glycolide) microparticles. Nano Lett. 2012;12:4131-9
38. Iwano S, Sugiyama M, Hama H, Watakabe A, Hasegawa N, Kuchimaru T. et al. Single-cell bioluminescence imaging of deep tissue in freely moving animals. Science. 2018;359:935-9
39. de Almeida PE, van Rappard JRM, Wu JC. In vivo bioluminescence for tracking cell fate and function. Am J Physiol Heart Circ Physiol. 2011;301:H663-71
40. Lahorte CM, Vanderheyden JL, Steinmetz N, van de Wiele C, Dierckx RA, Slegers G. Apoptosis-detecting radioligands: current state of the art and future perspectives. Eur J Nucl Med Mol Imaging. 2004;31:887-919
41. Kartachova M, van Zandwijk N, Burgers S, van Tinteren H, Verheij M, Valdés Olmos R A. Prognostic significance of 99mTc Hynic-rh-annexin V scintigraphy during platinum-based chemotherapy in advanced lung cancer. J Clin Oncol. 2007;25:2534-9
42. Jung HI. Detection of apoptosis using the C2A domain of synaptotagmin I. Bioconjugate Chem. 2004;15:983-7
43. Blankenberg FG. In vivo detection of apoptosis. J Nucl Med. 2008;49:81s-95s
44. Smrz D, Draberova L, Draber P. Non-apoptotic phosphatidylserine externalization induced by engagement of glycosylphosphatidylinositol-anchored proteins. J Biol Chem. 2007;282:10487-97
45. Smith AM, Mancini MC, Nie S. Bioimaging: second window for in vivo imaging. Nat Nanotechnol. 2009;4:710-1
46. Sharifi S, Seyednejad H, Laurent S, Atyabi F, Saei AA, Mahmoudi M. Superparamagnetic iron oxide nanoparticles for in vivo molecular and cellular imaging. Contrast Media Mol Imaging. 2015;10:329-55
47. Nejadnik H, Ye D, Lenkov OD, Doing JS, Martin JE, Castillo R. et al. Magnetic resonance imaging of stem cell apoptosis in arthritic joints with a caspase activatable contrast agent. ACS Nano. 2015;9:1150-60
48. MacDonald RJ, McDonald JS, Kallmes DF, Jentoft ME, Murray DL, Thielen KR. et al. Intracranial gadolinium deposition after contrast-enhanced MR imaging. Radiology. 2015;275:772-82
49. Serpooshan V, Sheibani S, Pushparai P, Woicik M, Jang AY, Santoso MR. et al. Effect of cell sex on uptake of nanoparticles: the overlooked factor at the nanobio interface. ACS Nano. 2018;12:2253-66
50. Corbo C, Molinaro R, Tabatabaei M, Farokhzad OC, Mahmoudi M. Personalized protein corona on nanoparticles and its clinical implications. Biomater Sci. 2017;5:378-87
51. Nejadnik H, Taghavi-Garmestani SM, Madsen SJ, Li K, Zanganeh S, Yang P. et al. The protein corona around nanoparticles facilitates stem cell labeling for clinical MR imaging. Radiology. 2018;286:938-47
52. Berman SC, Galpoththawela C, Gilad AA, Bulte JW, Walczak P. Long-term MR cell tracking of neural stem cells grafted in immunocompetent versus immunodeficient mice reveals distinct differences in contrast between live and dead cells. Magn Reson Med. 2011;65:564-74
53. Walczak P, Kedziorek DA, Gilad AA, Barnett BP, Bulte JW. Applicability and limitations of MR tracking of neural stem cells with asymmetric cell division and rapid turnover: the case of the shiverer dysmyelinated mouse brain. Magn Reson Med. 2007;58:261-9
54. Khurana A, Chapelin F, Beck G, Lenkov OD, Donig J, Nejadnik H. et al. Iron administration before stem cell harvest enables MR imaging tracking after transplantation. Radiology. 2013;69:186-97
Author contact
![]() Corresponding authors: Hossein Nejadnik (hossein-nejadnikedu), Heike E. Daldrup-Link (heikededu), Department of Radiology, Stanford School of Medicine, 725 Welch Rd, Rm 1665, Stanford, CA 94305-5654.
Corresponding authors: Hossein Nejadnik (hossein-nejadnikedu), Heike E. Daldrup-Link (heikededu), Department of Radiology, Stanford School of Medicine, 725 Welch Rd, Rm 1665, Stanford, CA 94305-5654.