Nanotheranostics
ISSN: 2206-7418
ISSN: 2206-7418
- Current Issue
- Volume 9; 2025
- Volume 8; 2024
- Volume 7; 2023
- Volume 6; 2022
- Volume 5; 2021
- Volume 4; 2020
- Volume 3; 2019
- Volume 2; 2018
- Volume 1; 2017
- Archive
- Editorial Board
- Cover Images
- Cover Suggestion
- Index & Coverage
- Special Issues
Top
Introduction
Materials and Methods
Results and Discussion
Conclusions
Abbreviations
Supplementary Material
Acknowledgements
References
Introduction
Materials and Methods
Results and Discussion
Conclusions
Abbreviations
Supplementary Material
Acknowledgements
References
International Journal of Biological Sciences
International Journal of Medical Sciences

 Global reach, higher impact
Nanotheranostics 2019; 3(2):196-211. doi:10.7150/ntno.34921 This issue Cite
Research Paper
Tumor-Activatable Clinical Nanoprobe for Cancer Imaging
Derek Reichel1, Manisha Tripathi1,5, Pramod Butte1, Rola Saouaf2,3, J. Manuel Perez1,2,4 ![]()
1. Department of Neurosurgery, Cedars-Sinai Medical Center, Los Angeles, CA 90048
2. Biomedical Imaging Research Institute, Cedars-Sinai Medical Center, Los Angeles, CA 90048
3. S. Mark Taper Foundation Imaging Center, Cedars-Sinai Medical Center, Los Angeles, CA 90048
4. Samuel Oschin Comprehensive Cancer Institute, Cedars-Sinai Medical Center, Los Angeles, CA 90048
5. Current Address: Department of Cell Biology and Biochemistry, Texas Tech University Health Sciences Center, Lubbock, TX, 79430
Received 2019-3-15; Accepted 2019-4-29; Published 2019-5-4
Citation:
Reichel D, Tripathi M, Butte P, Saouaf R, Perez JM. Tumor-Activatable Clinical Nanoprobe for Cancer Imaging. Nanotheranostics 2019; 3(2):196-211. doi:10.7150/ntno.34921. https://www.ntno.org/v03p0196.htm
Other stylesAbstract

Purpose: A successful cancer surgery requires the complete removal of cancerous tissue, while also sparing as much healthy, non-cancerous tissue as possible. To achieve this, an accurate identification of tumor boundaries during surgery is critical, but intra-operative tumor visualization remains challenging. Fluorescence imaging is a promising method to improve tumor detection and delineate tumor boundaries during surgery, but the lack of stable, long-circulating, clinically-translatable fluorescent probes that can identify tumors with high signal-to-noise ratios and low background fluorescence signals have prevented its widespread application.
Methods: We screened the optical properties of several fluorescent dyes before and after nanoprobe encapsulation, and then identified nanoprobes with quenched fluorescence that were re-activated upon dye release. The physical and biological properties of these nanoprobes leading to fluorescence activation were investigated in vitro. Further, the cancer imaging properties of both free dyes and nanoprobe-encapsulated dyes were compared in vivo.
Results: A novel fluorescent nanoprobe was prepared by combining two FDA-approved agents commonly used in the clinic: Feraheme (FH) and indocyanine green (ICG). The resulting FH-entrapped ICG nanoprobe [FH(ICG)] displayed quenched fluorescence compared to other nanoprobes, and this quenched fluorescence was re-activated in acidic tumor microenvironment conditions (pH 6.8) and upon uptake into cancer cells. Finally, in vivo studies in a prostate cancer mouse model demonstrated that FH(ICG) treatments enhance long-term fluorescence signals in tumors compared to ICG treatments, allowing for fluorescence-guided tumor identification using clinically relevant fluorescence cameras.
Conclusions: FH(ICG) nanoprobes were identified as fluorescent nanoprobes with beneficial fluorescence activation properties compared to other FH-entrapped dyes. The activatable nature of this nanoprobe allows for a low background fluorescence signal and high signal-to-noise ratio within a long-circulating nanoagent, which allows for long-term fluorescence signals from tumors that enabled their fluorescence-guided detection. This activatable nanoprobe offers tremendous potential as a clinically translatable image-guided cancer therapy modality that can be prepared in a clinical setting.
Keywords: Indocyanine green, Feraheme, fluorescence imaging, image-guided surgery, prostate cancer
Introduction
Surgical resection of tumors, either alone or in combination with chemotherapy or radiation, is the most common treatment method for solid tumors.[1] During tumor resection, surgeons must precisely identify cancerous lesions within the surrounding healthy tissue. Because tumors do not often exhibit well-defined boundaries separating cancerous and healthy tissue, surgeons may not accurately resect all cancer tissue from the patient during surgery. As a result, residual cancer cells can remain at the tumor boundary and regrow following surgery, causing tumor recurrence.[2, 3] To reduce the risk of recurrence following surgery, surgeons will often remove some of the healthy tissue surrounding cancerous lesions. However, clinicians must balance the risk of tumor recurrence with the importance of the surrounding healthy tissue for patient survival and quality of life. For example, large margins of healthy liver tissue surrounding liver tumors are often removed during surgery to reduce the risk of recurrence[4], but breast conserving surgery guidelines indicate that the removal of large tissue margins fails to decrease re-excision rates or improve cosmetic outcomes.[5] In addition, surgeons must also avoid damaging adjacent blood vessels and nerves in healthy tissues while removing tumors. During prostatectomies, damage to the neurovascular bundle can cause permanent erectile dysfunction and incontinence.[6] Thus, novel theranostic methods are needed to sensitively and selectively detect tumors and accurately identify their boundaries for effective surgical resection.
Pre-operative imaging methods have improved the identification of tumors. Common pre-operative imaging methods for cancer detection include positron emission tomography (PET) and magnetic resonance imaging (MRI).[7, 8] Due to its high spatial resolution, MRI is frequently used to non-invasively detect tumors in various organs.[9-11] MRI has become an increasingly important method for prostate cancer diagnosis,[12, 13] and clinicians have investigated the potential for MRI to replace prostate biopsies.[14] To enhance MRI sensitivity for tumor detection, nanoscale MR-responsive contrast agents have been developed.[15-19] In addition, Feraheme (FH), a clinical nanoformulation of iron oxide nanoparticles, has been investigated as an MRI contrast agent.[20-23] The nanoscale size and long circulation of FH allows for tumor uptake by the enhanced permeability and retention (EPR) effect to enhance tumor visualization by MRI, and theranostic devices using FH have been developed to improve cancer treatment.[24, 25] However, patient's organs may slightly shift between MR imaging and surgery, and surgeons still need to identify tumor boundaries visually during surgery.
Intra-operative imaging methods have overcome some limitations of pre-operative imaging for tumor detection. Some intra-operative tumor imaging methods include photoacoustic, Raman and fluorescence imaging.[26, 27] Several clinical imaging systems have been developed for intra-operative fluorescence imaging of dyes or other dye-labelled materials in humans.[28-30] Near-infrared (NIR) fluorescent dyes have been investigated in biomedical imaging applications because of their high fluorescence penetration through tissues and their large signal-to-noise ratios in comparison to other fluorescent dyes.[31] Unfortunately, the tumor detection capabilities of many NIR dyes are limited by fast renal clearance, poor biodistribution and tumor targeting, as well as non-selective fluorescent signals.[32] Thus, a long-circulating and tumor-targeting NIR fluorescent imaging agent that fluorescently labels tumors while minimizing background signals from surrounding healthy tissues is needed to overcome the limitations of fluorescence imaging of tumors using free NIR dyes for accurate and effective tumor resection.
Nanoparticle delivery of NIR dyes to tumors has been investigated to improve tumor detection during intra-operative imaging by increasing tumor fluorescence. Following systemic administration, nanoparticles can accumulate within tumors and surrounding tumor vasculature due to the enhanced permeation and retention (EPR) effect.[33] Thus, the systemic administration of dye-loaded nanoparticles is expected to enhance tumor fluorescence for intraoperative imaging. Unfortunately, nanoparticles can also accumulate in healthy organs such as the liver or spleen.[34] Specifically, FH treatments have increased iron accumulation in patient livers for several months following administration.[35] As a result, distinguishing fluorescence signals from tumor-localized nanoparticles and nanoparticles within healthy organs could be difficult. Therefore, novel methods are needed to increase NIR fluorescence signals from tumor-localized nanoparticles while also suppressing fluorescence from nanoparticles within healthy organs to prevent tumor regrowth and metastasis following surgery.
Tumor-responsive fluorescence activation of NIR fluorescent probes may enable effective tumor detection by increasing dye delivery to tumors, while minimizing background fluorescence. The unique physiological properties of the tumor microenvironment have been extensively studied,[36, 37] and nanoparticle-based drug delivery systems targeting these properties have been previously shown to increase drug delivery to tumors.[38] In a similar manner, quenched NIR fluorescent nanoprobes (OFF Fluorescence) that become activated (ON Fluorescence) upon being exposed to the tumor microenvironment or internalized by cancer cells could increase the tumor's fluorescent signal-to-noise ratio and minimize background fluorescence. Such an activatable fluorescent probe could aid physicians to better visualize tumor margins during surgery in real time by NIR fluorescence imaging.
We hypothesized that a FH-based imaging approach capable of quenching the fluorescence of a dye upon encapsulation (OFF state), while re-activating the dye's fluorescence (ON state) upon tumor targeting, could improve tumor visualization during surgical resection in real time (Figure 1). To test this hypothesis, several dye-loaded FH-based nanoparticles were prepared, and their fluorescence properties were screened. Based on this screening, ICG was identified as a dye with more significant fluorescence quenching upon encapsulation compared to other candidate dyes. The effects of nanoprobe preparation method, dye loading and storage conditions on ICG fluorescence quenching in FH were also investigated. Following these experiments, the physiological conditions causing nanoprobe fluorescence activation were screened in in vitro and in vivo experiments. We found that fluorescence quenching in nanoprobes was found to be dye concentration dependent, and fluorescence activation was accelerated in acidic conditions mimicking the extracellular tumor microenvironment. Further, fluorescence activation of nanoprobes following intravenous administration to mice enabled the fluorescence-based detection of prostate tumors with minimal interference from healthy tissues. Because these results were achieved using FDA-approved materials that were prepared following clinically translatable methods, these results have immediate potential to enhance the fluorescence-based detection of prostate tumors in clinical settings.
Materials and Methods
Materials
Fluorescent dyes indocyanine green (ICG) and IR-820 were purchased from Fisher Scientific (Waltham, MA), while BODIPY (4,4-difluoro-5,7-dimethyl-4-bora-3a,4a-diaza-s-indacene-3-propionic acid), DAPI (4′,6-diamidino-2-phenylindole), DiI (1,1'-dioctadecyl-3,3,3',3'-tetramethylindocarbocyanine perchlorate) and RhB (Rhodamine B octadecyl perchlorate ester) were purchased from Thermo Fisher Scientific (Waltham, MA). Feraheme (FH) is from AMAG Pharmaceuticals (Waltham, MA). Dimethyl sulfoxide (DMSO), acetonitrile (ACN), paraformaldehyde (PFA), Tween 20, centrifugal filters with a 30 kDa molecular weight cutoff (MWCO) and Slide-a-Lyzer dialysis devices (20 kDa MWCO) were procured from Fisher Scientific (Pittsburgh, PA). Deionized water was prepared using a Milli-Q reverse osmosis system (MilliporeSigma, Burlington, MA). Matrigel was purchased from BD Biosciences (Franklin Lakes, NJ). Cell Counting Kit-8 (CCK-8) was purchased from Dojindo (Kumamoto, Japan).
Figure 1
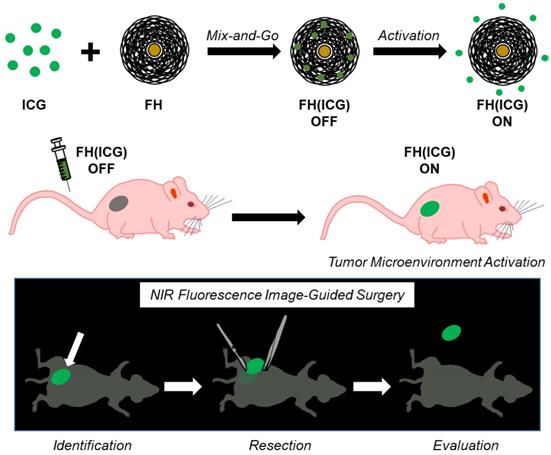
Schematic describing FH(ICG) for cancer imaging.
Cell Lines
Healthy prostate cell line RWPE-1 and prostate cancer cell lines PC3 and 22Rv1 were purchased from American Type Culture Collection (ATCC, Manassas, VA). Cell media RPMI 1640 and Keratinocyte-SFM (K-SFM) were purchased from Fisher Scientific (Pittsburgh, PA). Fetal Bovine Serum (FBS) was purchased from Atlanta Biologicals (Flowery Branch, GA). Antibiotic-Antimycotic solution (AA) was purchased from Thermo Fisher Scientific (Waltham, MA). PC3 and 22Rv1 cells were grown in RPMI 1640 media supplemented with 10% FBS and 1% AA, while RWPE-1 cells were grown in K-SFM supplemented with bovine pituitary extract (50 μg/ml), human epidermal growth factor (5 ng/ml) and 1% AA. Cells were cultured at 37°C in a humidified environment with 5% carbon dioxide and passaged as needed following all ATCC guidelines.
Animals and Tumor Models
All animals were handled following the Cedars-Sinai Institutional Animal Care and Use Committee (IACUC) guidelines. Six- to eight-week-old male nu/nu SCID mice were purchased from Charles River (Hopkinton. MA). Subcutaneous prostate tumors were established in these mice. Briefly, PC3 cells were suspended in a 1:1 mixture of RPMI-1640 media and Matrigel, and then mice were injected subcutaneously on the left and right flank with 1*106 PC3 cells on each side. Tumors were allowed to grow until they reached a volume of about 100 mm3 before the treatments.
Nanoprobe Loading by Solvent Diffusion
To assess the fluorescence quenching properties of FH, a series of dye-loaded FH nanoprobes were synthesized following a solvent diffusion method. These dye-loaded FH nanoprobes are denoted as FH(Dye), in which Dye is replaced with the name of the specific dye loaded into the nanoprobe (either ICG, IR-820, BODIPY, DiI or RhB). Briefly, 100 μl of each dye solution (10 mg/ml in DMSO) were added to 100 μl of FH (30 mg/ml iron) and 200 μl of PBS. The Dye-FH mixtures (2.5 mg/ml dye and 7.5 mg/ml iron in 25% DMSO) were then mixed for 3 h at room temperature to allow dyes to diffuse into FH. Dye-loaded FH nanoprobes were then purified by centrifugal filtration to remove both unentrapped dyes and DMSO, and then diluted to a 30 mM iron concentration with PBS. Centrifugal filtration was repeated until dye absorbance was not detected in the filtrate, and each sample was filtered a minimum of three times. Dye-loaded FH samples were stored in the dark at 4°C for future use.
ICG Loading into Nanoprobes by Mixing and Dissolving Methods
In addition to the solvent diffusion method, two new methods were developed for the fabrication of FH(ICG) nanoprobes: (1) the mixing method and (2) the dissolving methods. These methods were expected to facilitate the clinical adoption of FH(ICG) by reducing the need for nanoprobe purification following preparation. For the mixing method, 100 μl of ICG solution (10 mg/ml in deionized water) was added to 100 μl of FH solution (30 mg/ml iron). For the dissolving method, 1.0 mg of ICG was dissolved in 100 μl of FH solution (30 mg/ml iron). FH(ICG) solutions from either preparation method were mixed for 3 h at room temperature and then diluted to a 30 mM iron concentration with either PBS or saline. FH(ICG) solutions (555.6 μg/ml ICG, 1.67 mg/ml or 30 mM iron) were stored in the dark at 4°C for future use. To verify fluorescence activation of FH(ICG) nanoprobes, 250 µl of FH(ICG) was diluted with either 250 µl of PBS, 2% DMSO in PBS, 10% DMSO in PBS, 20% DMSO in PBS or DMSO, and then fluorescence images of these samples were taken. The mixing method was followed to generate the FH(ICG) probe used in the rest of the experiments.
Nanoprobe Optical Characterization
For each dye-loaded nanoprobe, the changes in absorbance and fluorescence between encapsulated and released dye were measured at equal molar nanoprobe concentrations. Briefly, the nanoprobes were dissolved in PBS for encapsulated dye measurements, or in a 1:1 PBS:DMSO mixture for released dye measurements. The absorbance spectra of encapsulated and released dyes were measured using a SpectraMax M5 plate reader (Molecular Devices, San Jose, CA). The absorbance spectra for each dye were normalized to the absorbance peak of the released dye. Samples with high concentrations of dye were diluted until their absorbance values were within the linear range of measurement for the plate reader. Fluorescence measurements for NIRF dyes were performed using an Odyssey fluorescence imager (Li-COR, Lincoln, NE), while fluorescence measurements for other dyes were performed using a plate reader. For NIRF dyes, fluorescence was measured using the 800 nm channel (Ex 785 nm/Broad Emission). For dyes in the visible light range, the fluorescence emission peak wavelength was determined by measuring a fluorescence emission spectrum using the dye absorbance peak wavelength as the excitation wavelength. Then, the fluorescence of the encapsulated and released dyes was measured. The fluorescence spectra and endpoint measurements for FH(ICG), FH(IR-820), FH(BODIPY) and FH(RhB) dye were normalized to the fluorescence peak of the released dye, while the FH(DiI) measurements were normalized to the fluorescence peak of the encapsulated dye.
Physical-Chemical Characterization of FH(ICG) Nanoprobe
The size and surface charge of FH and FH(ICG) were determined by dynamic light scattering (DLS) using a Zetasizer Nano ZS90 (Malvern Instruments, Malvern, UK). FH was dissolved in PBS at a 30 mM iron concentration, while FH(ICG) was dissolved in PBS at a 1 mM iron concentration to avoid potential sample interference with the instrument laser. Size histograms for each sample indicate one representative measurement. The physical stability of FH and FH(ICG) stored at either 4°C or 25°C was determined by measuring their diameter at various timepoints over a 28-day period. The fluorescence stability was also measured. Briefly, ICG and FH(ICG) were dissolved at 10 μg/ml ICG concentration in PBS and stored either in the dark at 4°C or on the bench top at 25°C. At various time points, aliquots of each sample were taken and diluted 1:1 with DMSO. The fluorescence of these samples was measured with the fluorescence imager, and the fluorescence measurements were normalized to the fluorescence at the initial timepoint. The fluorescence quenching stability was also measured. Briefly, FH(ICG) was diluted to 30 mM iron in PBS and stored either at 4 in the dark at 4°C or on the bench top in the light at 25°C. At various timepoints, FH(ICG) aliquots were diluted 1:100 in PBS and the fluorescence was measured on the fluorescence imager. FH(ICG) fluorescence was normalized to the fluorescence of identical FH(ICG) concentration samples in 1:1 DMSO:PBS.
Dye Loading Optimization of FH(ICG)
To determine the effect of increased ICG loading on the fluorescence properties of FH(ICG), various amounts of ICG were loaded into FH using the dissolving method with slight modifications. Briefly, either 0, 1, 2, 5, 10, 20, 40 or 60 mg of ICG was dissolved in 100 μl of FH solution (30 mg/ml iron). To assure that ICG could dissolve, 900 μl of deionized water was added to each sample, and then the samples were heated to 37°C. Heating was used in this case to guarantee solubilization of ICG at high concentrations. Samples were cooled to room temperature and then centrifuged at 1000 RPM for 1 minute to precipitate any insoluble ICG. ICG was quantified in the supernatants of each sample. Briefly, 200 μl of ACN was added to 200 μl of each sample and then mixed for 2 h at room temperature. The samples were then centrifuged to precipitate iron, and the supernatant was collected. The absorbance of the supernatant at 780 nm was compared to a calibration curve of known concentration ICG standards using a plate reader. Because of the high absorbance of dye, samples were diluted with 1:1 PBS:ACN until the measurements were within the linear range of detection. The measured concentration of ICG in FH(ICG) was graphed against the amount of dye added to the sample, and the data was fit to a first order exponential model using Prism 5 (Graphpad, La Jolla, CA). For each sample, the encapsulation efficiency of ICG and the ICG loading were calculated. The encapsulation efficiency was defined as the percent mass of dye measured in samples relative to the mass of dye added, and the ICG loading was defined as the percent mass of dye measured in samples relative to the mass of dye and FH. As it was found that 1 mg of ICG was optimal to generate the FH(ICG) probes, this amount of ICG was chosen to fabricate the FH(ICG) with no heating step required, as ICG is soluble at this concentration.
Fluorescence Characterization of FH(ICG)
FH(ICG) with an added ICG amount of 1, 2, 5, 10 and 20 mg/ml were dissolved at a 3 mM iron concentration in either PBS or 1:1 PBS:DMSO to mimic FH(ICG) or released dye from FH(ICG), respectively. The fluorescence of these samples was measured using an Odyssey fluorescence imager (Li-COR, Lincoln, NE). For each sample, the change in fluorescence and fluorescence activation were calculated. The change in fluorescence was defined as the difference in fluorescence between released ICG and FH(ICG), while the fluorescence activation was defined as the fluorescence of released dye divided by the fluorescence of the FH(ICG). For these parameters, the error was propagated from each fluorescence measurement.
Cytotoxicity of FH(ICG)
The cytotoxicity of FH(ICG) was measured in multiple cell lines using a CCK-8 assay. Briefly, PC3, 22Rv1 and RWPE-1 cells were seeded at 5000 cells per well in 96 well plates and allowed to adhere overnight. Cells were then treated with various concentrations of FH(ICG). After 72 h, the media was changed, and cells were treated with 10 μl of CCK-8 solution. The cells were then incubated at 37°C for 3 h, and the absorbance of the wells was measured at 450 nm using a plate reader. The percent cell viability was calculated by subtracting the absorbance of a blank sample from the measurement, and then dividing the sample absorbance by the absorbance of a blank sample-corrected untreated sample.
In Vitro Activation of FH(ICG)
Nanoprobes were incubated in various buffers at 37°C for 48 h, and the effects of buffer serum content (0% or 20% FBS in pH 7.4 PBS) and pH (7.4 or 6.8 in 20% FBS) on nanoprobe fluorescence activation were determined. Briefly, FH(ICG) was dissolved at 25 μg/ml ICG concentration in each dialysis buffer solution, and 500 μl of each sample was added to dialysis devices. Samples were dialyzed, and the FH(ICG) dialysis solutions were sampled at various timepoints. The dialysis solution was changed after each timepoint to assure a sink condition for nanoprobe activation. The previously collected FH(ICG) samples were diluted in DMSO (1:1 v/v), and the fluorescence of the diluted samples was measured at each timepoint. The cumulative fluorescence of ICG release into the dialysis solution at each timepoint was calculated, and the fluorescence was normalized to the cumulative fluorescence of released dye during 7 days. In addition, no dye absorbance was observed in dialysis cups after 7 days of release, indicating that ICG was completely released from FH(ICG).
Intracellular Activation of FH(ICG) in Cell Culture
The intracellular activation of FH(ICG) was measured and compared to a non-activatable nanoprobe FH(RhB), in order to assess the contributions of both nanoprobe uptake and activation on intracellular fluorescence activation. Briefly, PC3 and 22Rv1 cells were seeded at 100,000 cells per well in 6 well plated. The cells were treated with FH(ICG) or FH(RhB) (300 μM iron for each). After 0, 1, 3, 6 or 24 h of treatment, the media was removed, cells were washed with PBS, and then cells were fixed with PFA (4% in PBS). Cells were then treated with the nuclear stain DAPI (300 nM in PBS) and imaged on a fluorescence microscope (Keycene BZ-X710, Keycene, Osaka, Japan). Fluorescence images of the nuclei (DAPI filter, Ex 360±40 nm, Em 460±50 nm), RhB (GFP Filter, Ex 470±40 nm, Em 525±50 nm) or ICG (Cy7 filter, Ex 710±40 nm, Em 810±45 nm) were taken. For each cell line, fluorescence images were taken at a constant brightness and exposure time. Five images were taken for each well, and the total nuclei, RhB and DAPI signals were quantified in each image using ImageJ (NIH, Bethesda, MD). Cells images were taken in fields with similar cell densities for each cell line (22Rv1, 15-20 cells per image; PC3, 10-15 cells per image). Fluorescence signals of RhB and ICG were normalized to DAPI signals to account for cell density differences between images, and the RhB/DAPI or ICG/DAPI signals over time were compared. All fluorescence ratio values were normalized to the fluorescence of the 24 h timepoint.
In Vivo Activation and Fluorescence Bio-Distribution of FH(ICG) in Mice
Male mice bearing subcutaneous prostate tumors were injected intravenously with either FH(ICG) (2.2 mg ICG/kg, 7 mg iron [Fe]/kg) or ICG (2.2 mg ICG/kg). At 6, 24 or 48 h post-injection, mice were euthanized and their brains, hearts, lungs, liver, kidneys, spleens and tumors were collected. Fluorescence images of these organs were taken using an Odyssey fluorescence imager (Li-COR, Lincoln, NE), and the total fluorescence in each organ was quantified. The mean fluorescence per unit area of the organs was compared between treatments for each timepoint. In addition, mice bearing subcutaneous prostate tumors were injected with ICG or FH(ICG) and imaged 48h post-injection using an In Vivo Imaging System (IVIS, PerkinElmer, Waltham, MA) or a Synchronized near-InfraRed Imaging System (SIRIS, developed in-house). Similar experiments were performed with a higher dose of FH(ICG) (4.4 mg ICG/kg, 14 mg iron [Fe]/kg) and imaging after 5 days.
Statistics
All measurements were performed in triplicate and reported as mean ±standard deviation, unless otherwise noted. Pairs of measurements were compared using a Student's t-test, while groups of measurements were compared using a one-way ANOVA with Bonferroni's post-test correction. In all figures, statistical significance is indicated by * (p<0.05), ** (p<0.01), *** (p<0.001) , **** (p<0.0001) or n.s. (p>0.05).
Results and Discussion
Dye Screening and Nanoprobe Selection
To identify a dye that would quench upon encapsulation, we prepared several dye-loaded FH nanoprobes (FH(Dye)) and measured the fluorescence properties of both the FH(Dye) probes and the released dyes from FH. The FH(Dye) nanoprobes were prepared following a solvent diffusion method, where the dyes are first dissolved in an organic water-miscible solvent before encapsulation [18]. Dye release was induced by adding DMSO to the FH(Dye) nanoprobe in a 1:1 ratio. First, the fluorescence of FH(Dye) before and after dye release was measured. We defined the fluorescence activation ratio of the corresponding FH-encapsulated dye as the fluorescence ratio of the DMSO-treated FH(Dye) sample to the non-treated FH(Dye) without DMSO. A large fluorescence activation ratio was observed in FH(Dye) preparations where the dye was ICG or IR820, followed by BODIPY and RhB (Figure 2A). The corresponding fluorescence and absorbance spectra of all the FH(Dye) studied before and after dye release are in Figure S1. Encapsulation of ICG, IR820, BODIPY or RhB into FH suppressed dye fluorescence (OFF probes) to a certain degree and fluorescent activation (ON probe) is observed upon addition of DMSO, which triggers dye release. However, both BODIPY and RhB demonstrate only modest changes in fluorescence upon DMSO addition (activation ratio<2). Therefore, although many dyes change fluorescence upon encapsulation, only ICG and IR820 could be used to engineer activatable FH(Dye) probes. In contrast, encapsulation of DiI increased its fluorescence as the fluorescence of the encapsulated dye is larger than that of the release dye (Figure S1). This observation was expected, because DiI exhibits increased fluorescence upon interactions with hydrophobic environments such as the cell membrane.[39] Therefore, FH(DiI) is not an activatable fluorescent probe as it is always ON as long as the dye is encapsulated.
ICG had the largest fluorescence activation ratio of the dyes we screened, which corresponds to a 60-fold increase in fluorescence following activation. FH encapsulation decreased the absorbance of IR-820 and RhB, but encapsulation increased the absorbance of DiI. The absorbance of ICG decreased following encapsulation. In addition, encapsulation had minimal effects on BODIPY absorbance. FH altered the absorbance wavelength maxima of some dyes (ICG, 782 nm to 842 nm; IR-820, 824 nm to 696 nm; DiI, 566 nm to 520 nm), but had minimal effects on other dyes (RhB, 572 nm to 572 nm; BODIPY, 506 nm to 504 nm). Because ICG demonstrated the largest fluorescence activation ratio of the dyes we screened, FH(ICG) nanoprobes were selected for further studies. In addition, the FDA approval status of ICG can facilitate the potential clinical translation of the activatable FH(ICG) nanoprobes.
Free ICG has an absorbance peak at 780 nm with a shoulder peak at 700 nm (Figure 2B), which decreases and broadens following FH encapsulation. It has been previously reported that these change in the absorbance spectra of ICG correspond to ICG aggregation.[40] Upon dye release, the absorbance of ICG behaves similarly to free ICG (data not shown). Based on this observation, it is hypothesized that encapsulation of fluorescent dyes by FH induces dye aggregation within the nanoprobe, decreasing dye fluorescence. However, additional experiments are needed to fully assess this proposed fluorescence quenching mechanism of FH. Previous studies have reported modest fluorescence quenching of ICG following nanoparticle encapsulation,[41, 42] while other studies indicate that interactions between ICG and lipids within nanoparticles are expected to increase entrapped dye fluorescence in a dye loading-dependent manner.[43] Our results demonstrate that FH encapsulation of ICG can significantly quench dye fluorescence compared to previously reported nanoprobes, potentially decreasing their background fluorescence signals and enabling long-term fluorescence-based detection of tumors. In addition, these results further verify that the fluorescence effects of nanoparticle encapsulation on ICG are both material dependent and sensitive to the concentration of ICG within the nanoparticle.
Figure 2
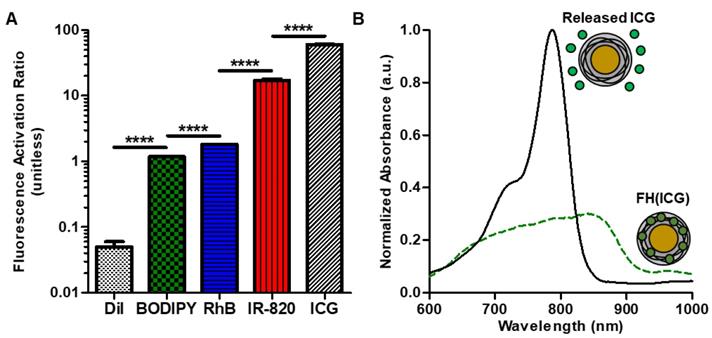
Optical properties of dye-loaded FH nanoprobes. Fluorescence activation ratios of dye-loaded FH nanoprobes. Error bars are small (A). Absorbance spectra of FH(ICG) and released ICG (B).
Figure 3
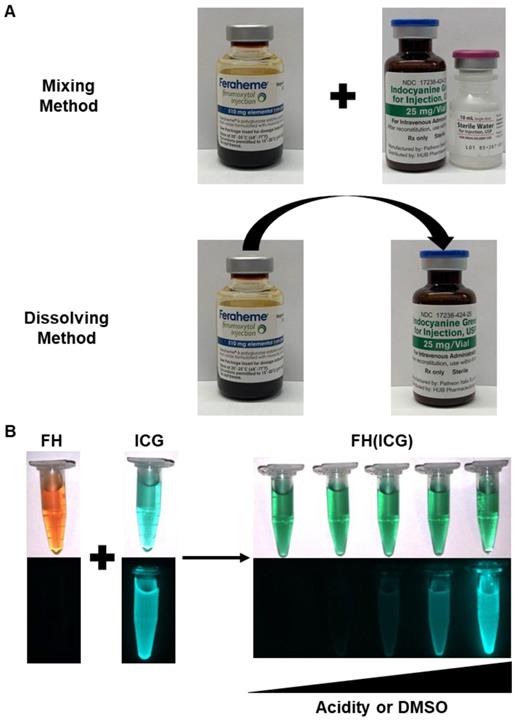
Clinical preparation method development for FH(ICG) preparation. The FH(ICG) can be prepared by either a mixing method or a dissolving method (A). Either method generates a FH(ICG) formulation with quenched fluorescence that is restored upon increasing amounts of DMSO or decreasing pH that triggers dye release (B). In part B, the top images are brightfield images, while the bottom images are NIR fluorescence images.
Clinically Translatable FH(ICG) Preparation Method Development
The FH(ICG) nanoprobe was initially prepared using the solvent diffusion methods which involves the use of organic solvent to dissolve the dyes, followed by dialysis or centrifugal filtration for complete removal of residual organic solvent. As ICG is water soluble, we hypothesized that an ICG loading method free of organic solvent could be developed that avoids the use of further purification methods and allows for a simple, direct translation into clinical preparation. To achieve this goal, two water-based and purification-free FH(ICG) preparation methods were developed, (1) the mixing method and (2) the dissolving method (Figure 3A). For the mixing method, ICG was first dissolved in deionized water per manufacturer instructions at 10 mg ICG/mL and mixed to the FH solution (30 mg Fe/ml), and then further diluted to the required sample concentration (0.56 mg ICG and 1.67 mg iron/ml) in saline or PBS. In the dissolving method, ICG, which is supplied as a crystalline solid, was dissolved directly with the FH solution and then diluted to the necessary sample concentration (0.56 mg ICG and 1.67 mg iron/ml) with saline or PBS. Following both FH(ICG) preparation methods, the encapsulation of ICG was quantified by precipitating iron from the nanoparticles and measuring ICG absorbance in the supernatant (Figure S2). Both the mixing and dissolving methods achieved quantitative encapsulation of ICG (100.1±0.5% for mixing method, 98.9±1.8% for dissolving method) at the selected mixing ratio. In addition, both methods produced stable FH(ICG) preparations with quenched fluorescence that can be activated by release of the encapsulated dye (Figure 3B). The calculated molar ratio of ICG to FH was 140.5±0.7 for the mixing method and 138.8±2.5 for the dissolving method. FH(ICG) nanoprobes prepared by the solvent diffusion, mixing and dissolving methods demonstrated similar fluorescence activation ratios (Figure S3), which further indicates that either one of the water-based purification-free FH(ICG) methods can be easily performed in clinical settings. However, in this study we will focus on the mixing method as it follows clinical protocols of dissolving ICG in water first before administration and allows for a “mix-and-go' protocol for FH(ICG) preparation and immediate clinical use.
The novel translational approach outlined in this study offers significant benefits over other ICG-loaded nanoparticles. Previously, some research groups have developed ICG-loaded nanoparticles by maximizing the fluorescence signals of entrapped ICG.[43, 44] This was achieved by optimizing the amount of encapsulated ICG in the nanoparticle in order to yield a probe that is always ON. Unfortunately, it was noted that both ICG-loaded nanoparticle and released ICG fluorescence could be measured in nanoparticle samples that were developed using this approach. In contrast, we have developed activatable FH(ICG) nanoprobes with initial minimal fluorescence signals (OFF) by maximizing the amount of ICG encapsulated in FH (quenched state) and allowing for the selective activation due to dye release. By maximizing the difference between FH(ICG) and released ICG fluorescence, we expect to observe only activated nanoprobes, which could minimize background signals and enhance tumor fluorescence.
ICG Loading Modulates Nanoprobe Fluorescence Activation Properties
To further investigate the effect of dye loading on fluorescence activation, various FH(ICG) preparations were made by loading increasing amounts of ICG (1-60 mg) into identical amounts of FH (300 µg Fe). For this experiment, the dissolving method was used rather than the mixing method to minimize potential adsorption of ICG in high concentration samples to plastic tubes and pipettes during addition, which would reduce the accuracy of the values added. As expected, ICG loading into FH(ICG) increased as the amount of dye added was increased (Figure 4A). The drug loading data was fit to an exponential association model, and the model indicated that FH(ICG) had a theoretical maximum dye concentration of 30.4±0.7 mg/ml. As the dye loading in FH(ICG) increased, the encapsulation efficiency decreased (Figure 4B). Increasing ICG loading into FH decreased both encapsulated and released dye fluorescence. In fact, increased ICG loading decreased the difference between released and encapsulated dye fluorescence (Figure 4C), while also increasing the fluorescence activation ratio of nanoprobes (Figure 4D). Although released ICG is present in a 1:1 PBS:DMSO environment that is expected to reverse all self-quenching of ICG molecules, it may be possible that ICG encapsulated in FH at large concentrations becomes irreversibly self-quenched even following dye release, leading to reduced dye increases at higher dye loading values. Because a large numerical difference in fluorescence intensity between released and encapsulated dye was desired, we selected a 1 mg dye loading into FH for further experiments.
Dye Loading Does Not Alter Nanoprobe Physical Properties
The physical properties of FH(ICG) were further characterized. FH and FH(ICG) had similar diameters and zeta potentials (Figures 5A and 5B). Because FH and FH(ICG) have similar diameters, FH(ICG) is expected to accumulate within tumors in a similar manner to FH[45]. The negative zeta potential value indicates that FH(ICG) has a negative surface charge. FH(ICG) had a more negative zeta potential than FH, presumably due to the localization of ICG sulfate groups on the nanoprobe surface. Size measurements indicate that FH(ICG) remains stable during storage at either 4°C or 25°C for up to 28 days (Figure 5C). No fluorescence activation of FH(ICG) or ICG release was observed during storage in water at 4°C for up to 28 days (Figure S4), and the photostability profile of FH(ICG) was similar to free ICG (Figure S5). As expected, FH(ICG) was not toxic to either prostate cancer or healthy prostate cell lines (Figure S6).
Nanoprobe Activation is Accelerated in Acidic Tumor Microenvironments
The physical conditions causing nanoprobe activation were interrogated using an in vitro dynamic dialysis release experiment that allows for the separation of released ICG from FH(ICG). The pH values 7.4 and 6.8 were selected in these experiments to represent healthy tissue and tumor tissue pH, while serum was used to induce protein adsorption to the surface of FH(ICG). The activation profiles of FH(ICG) followed a controlled release profile and did not demonstrate burst release. The presence of serum decreased dye release at pH 7.4, suggesting that protein binding to the surface of FH(ICG) prevents dye from leaving the nanoparticle (Figure 5D). Meanwhile, nanoprobe activation rates in serum increased by about 150 percent at pH 6.8 compared to 7.4 (Figure 5E). Conditions in the presence of serum at pH 7.4 and using physiological temperature (37°C) used in this study simulated conditions in circulation and results suggest that in circulation the presence of serum will minimize ICG release and fluorescence activation.
Figure 4
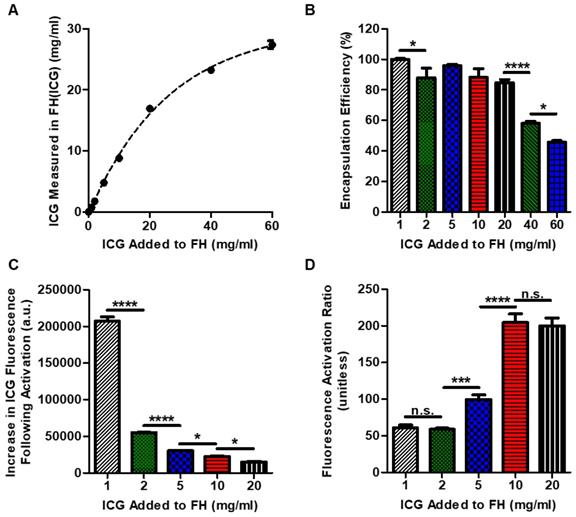
Dye loading optimization of FH(ICG) and effects of dye loading on FH(ICG) fluorescence. ICG loading could be controlled by adjusting the mixing ratio of FH and ICG (A). The dotted line indicated an exponential association fit of the data. Encapsulation efficiency of ICG at various dye loading values (B). Fluorescence increase (C), and fluorescence activation ratios of FH(ICG) at various dye loadings (D).
Even though ICG, ICG-based dye conjugates and ICG-loaded nanoparticles have been previously studied for tumor detection,[46-50] the effects of ICG quenching and activation on cancer imaging have not been thoroughly considered. Holt et al. demonstrated that following ICG administration, ICG-based fluorescence imaging failed to distinguish between cancerous tissues and non-cancerous inflamed tissues.[51] Because of this, ICG imaging alone could introduce false positive fluorescence signals and cause surgeons to remove healthy tissue. In addition, many nanoparticles are expected to accumulate in the liver and spleen following systemic administration due to interactions with the mononuclear phagocytotic system (MPS).[52] As a result, nanoprobes with ON fluorescence may accumulate in non-cancerous tissues surrounding tumors and complicate the delineation of tumor margins. In contrast, FH(ICG) nanoprobes becoming fluorescent upon triggered ICG release in environments mimicking the acidic extracellular tumor microenvironment. Thus, FH(ICG) nanoprobes offer a distinct imaging advantage over other previously reported ICG-based nanoprobes. However, it should be noted that FH(ICG) nanoprobes could introduce false positive signals in acidic inflamed tissues, and future studies are needed to optimize FH(ICG) dosing regimens to study and minimize this potential effect.
Quenched Nanoprobes Can Activate Following Intracellular Uptake
Based on the physical characterization of FH(ICG), we hypothesized FH(ICG) nanoprobes activation to be enhanced in the acidic extracellular tumor environment. In addition, we wanted to assess the fate of FH(ICG) nanoprobes that are potentially taken up by cancer cells before undergoing complete activation in the extracellular acidic tumor microenvironment. To investigate this, we treated 22Rv1 and PC3 prostate cancer cell lines with FH(ICG) and measured intracellular fluorescence over time (Figure 6). To assess the effects of cellular uptake on the observed intracellular fluorescence activation, we also treated cells with a non-activatable fluorescent nanoprobe FH(RhB) (Figure 6A). Because both FH(ICG) and FH(RhB) have similar size and negative surface charges [FH(ICG): 17.9±2.7 nm diameter, -30.1±1.8 mV zeta potential, FH(RhB): 18.9±0.8 nm diameter, -12.1±1.4 mV zeta potential], they are expected to have similar cellular uptake patterns. Nanoprobe fluorescence in cell images was quantified and then normalized to DAPI signals to account for cell size and density differences between images (Figures S7-S10). FH(ICG)-treated cells demonstrated low fluorescence that gradually increased within 24 h post-treatment (Figure 6B), signaling cellular activation. In contrast, FH(RhB)-treated cells exhibited high fluorescence after just 1 h of treatment that remained constant up to 24 h post-treatment (Figure 6C). These results suggest that nanoprobe uptake occurs within 1 h following treatment, and that activation of FH(ICG) can still occur within cancer cells following uptake of quenched nanoprobes, despite the lack of an acidic extracellular microenvironment in vitro and the less acidic pH of the intracellular tumor microenvironment compared to the extracellular tumor microenvironment (pH 7.0-7.2 vs. pH 6.8). To further elucidate the effects of cellular uptake on fluorescence activation of nanoprobes, we attempted to develop nanoprobes containing both activatable and non-activatable nanoprobes. However, these nanoprobes demonstrated different fluorescence activation rates and dye loading values compared to individually loaded nanoprobes. Overall, our findings suggest that fluorescence signals of FH(ICG) nanoprobes within tumors could be attributed to a combination of extracellular tumor microenvironment activation and intracellular nanoprobe activation, and that intracellular nanoprobe activation could contribute to fluorescence signals in healthy organs.
Figure 5
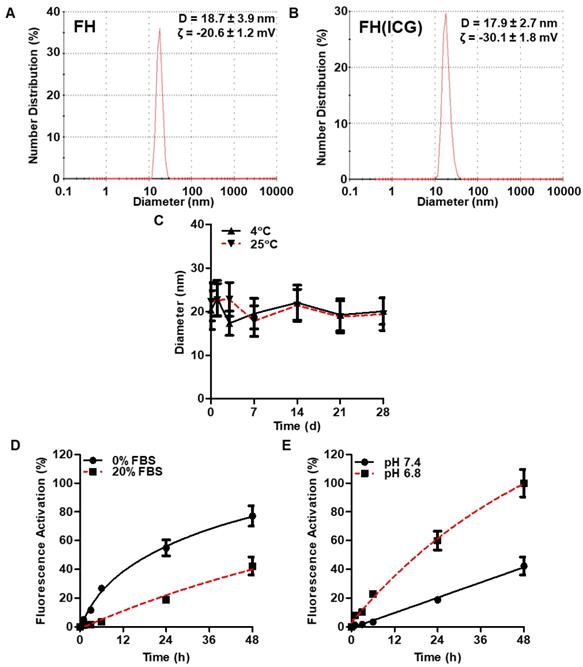
Physical-chemical properties of FH(ICG). DLS measurements of FH and FH(ICG) (A,B). Physical stability of FH(ICG) for up to 28 days of storage at either 4 or 25°C (C). Representative fluorescence activation profile of FH(ICG) at various serum concentration (D) and pH values (E) at 37°C for up to 48 h.
Figure 6
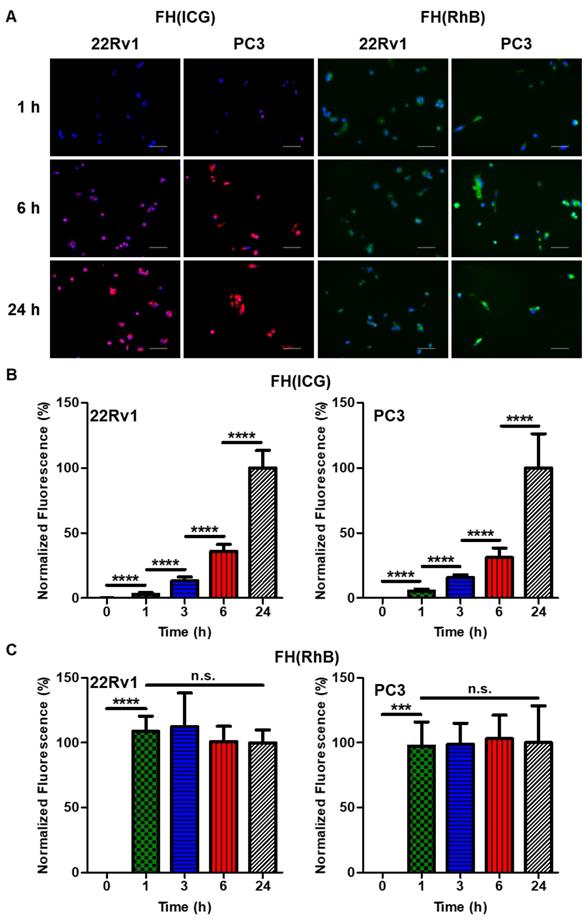
Intracellular activation of FH(ICG) and elucidation of FH(ICG) activation mechanism. Representative fluorescence images of 22Rv1 and PC3 prostate cancer cells treated with either FH(RhB) or FH(ICG) for 1, 6 or 24 h (A). DAPI-normalized fluorescence signals of FH(ICG)-treated cells (B) and FH(RhB)-treated cells (C). Values are mean±standard deviation of 5 images for each timepoint.
Nanoprobe Fluorescence Activation Enables Prostate Tumor Detection in Mice
Next, the in vivo fluorescence activation of FH(ICG) was investigated in nude mice bearing subcutaneous human prostate cancer tumors. Mice were injected with either free ICG (2.2 mg ICG/kg) or FH(ICG) (2.2 mg ICG/kg, 7 mg iron/kg). At 6 h post FH(ICG) administration via tail vein injection, mice had 66% less total fluorescence in all major organs than ICG-treated mice, while at 24 h, FH(ICG)-treated mice had 59% less total fluorescence than ICG-treated mice (Figure 7A). However, at 48 h post-treatment, both FH(ICG)- and ICG-treated mice had similar amounts of fluorescence from all major organs. In fact, FH(ICG)-treated mice demonstrated greater fluorescence at 48 h post-treatment than 24 h post-treatment, suggesting that fluorescence activation of the FH(ICG) nanoprobes increased the fluorescence signal within mice. Furthermore, following a more detailed organ analysis of fluorescence distribution at 48 h, we found that FH(ICG) treatments increased fluorescence signals in tumors from activated ICG compared to ICG treatments, without significantly affecting fluorescence signals from other organs (Figure 7B). It should be emphasized that we measured the fluorescence signal distribution of each treatment within major organs, and that fluorescence signal distribution does not necessarily represent the quantitative biodistribution of ICG in each organ. Rather, the observed fluorescence signals are due to a combination of nanoprobe activation and distribution leading to an increase in activated ICG accumulation within tumors. Literature indicates that ICG clears rapidly from the body,[53] while FH remains in the body for several days[54]. In addition, reports have indicated that nanoparticle encapsulation decreases the clearance of ICG from the body.[55, 56] Therefore, it is believed that FH(ICG) treatment increases the amount of ICG within the body compared to ICG treatment, while reducing fluorescence signals from the remaining ICG.
When mice bearing subcutaneous prostate cancer tumors (PC3) were injected with ICG and imaged using an In Vivo Imaging System (IVIS) 48 h later, results showed that the ICG-treated mice had weak fluorescence at the tumor, presumably due to renal clearance of ICG (Figure 7C). In contrast, mice treated with FH(ICG) demonstrated strong tumor-associated fluorescence. Quantification of fluorescence signals from tumors indicates that FH(ICG) treatment increased tumor signals by about 80% compared to ICG treatments (Figure 7D).
Finally, we wanted to assess the capabilities of FH(ICG) for long-term fluorescence imaging of tumors. To test this, we injected mice with a higher dose of FH(ICG) (2 mg ICG/kg, 7 mg iron/kg) and imaged 5 days after injection using the IVIS and an in-house intraoperative fluorescence imaging system termed Synchronized Infrared Imaging System (SIRIS). The SIRIS camera was specially designed to detect in vivo fluorescence signals from ICG or ICG-labelled molecules during intraoperative surgery,[30] and it is currently being tested in clinical trials. Results show tumor-associated fluorescent using both imaging systems, IVIS (Figure 7E) and SIRIS (Figure 7F). Most importantly, using the SIRIS system, a brightly fluorescent tumor is observed which allowed for the tumor to be separated from the surrounding tissue during a mock fluorescence-guided surgery (Figure S11). In addition, minimal fluorescence was observed from organs within the peritoneal cavity during surgery. In contrast, we were unable to delineate prostate tumors in ICG-treated mice. Further optimization of FH(ICG) dosing and imaging timepoints may increase the fluorescence signals from tumors while maintaining minimal background signals. In future work, we will assess the efficacy of FH(ICG) to identify orthotopic and metastatic tumors in animal models.
Conclusions
In summary, we report a novel activatable NIR fluorescent FH(ICG) nanoprobe with translational potential for clinical cancer imaging, offering a great benefit in the visualization of tumors during surgery. In contrast to other nanoprobes, the developed FH(ICG) nanoprobe demonstrated quenched fluorescence upon ICG encapsulation, while becoming fluorescent upon triggered ICG release. Two water-based preparation methods were developed in this work to prepare the FH(ICG) nanoprobes using two commonly used FDA approved imaging agents without further purification or manipulation. Further, the activatable fluorescent nature of FH(ICG) allows for bright tumor detection, even when the probe is non-fluorescent (OFF) in solution upon injection, without interference from other organs. We reasoned that the rapid tumor uptake of FH(ICG) and subsequent activation by the acidic tumor microenvironment allows for the observed tumor fluorescence labeling with low background fluorescence. Since FH has been used as an MRI contrast agent, FH(ICG) could be a useful tool to detect tumors both pre-operatively, via MRI detection of FH, and intra-operatively, via NIR fluorescence activation of the encapsulated ICG. Based on its ease of preparation and tumor detection capabilities, FH(ICG) could undergo fast clinical translation, after human clinical trials, for the MRI detection of tumors prior to surgery and the fluorescence imaging of tumors during surgery.
Abbreviations
ACN, acetonitrile; BODIPY, 4,4-difluoro-5,7-dimethyl-4-bora-3a,4a-diaza-s-indacene-3-propionic acid; DiI, 1,1'-dioctadecyl-3,3,3',3'-tetramethylindocarbo_cyanine perchlorate; DMSO, dimethyl sulfoxide; Ex, excitation; Em, emission; FH, Feraheme; FH(ICG), ICG-loaded feraheme; ICG, indocyanine green; PBS, phosphate buffered saline; PFA, paraformaldehyde; RhB, rhodamine B octadecyl ester perchlorate.
Figure 7
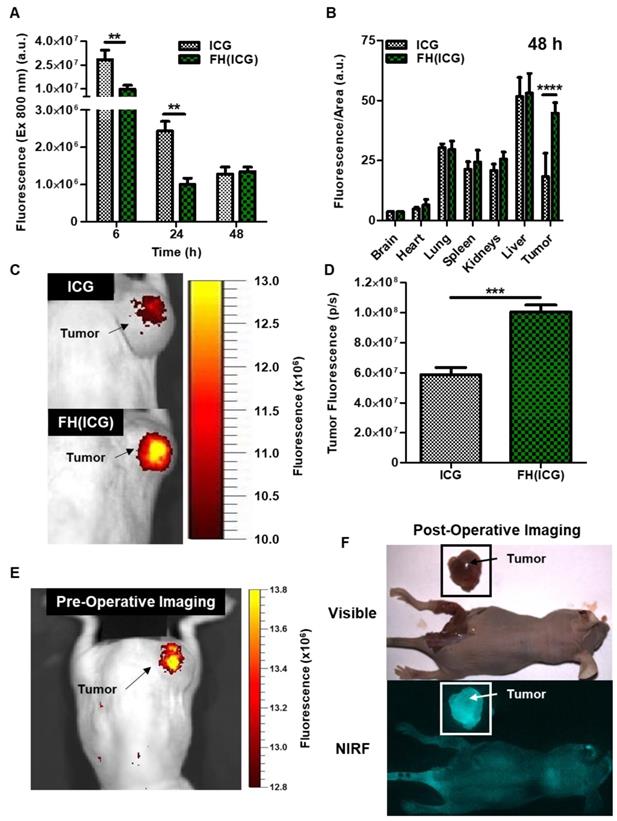
Enhanced fluorescence of tumors from FH(ICG)-treated mice enabled fluorescence-based tumor resection. Total fluorescence in mice was quantified at various time points following treatment (A). Fluorescence distribution on each organ at 6, 24 and 48 h post-injection (B). Representative NIR fluorescence image of a mouse treated with ICG (C) or FH(ICG) (D) 48 h after probe administration. Representative NIR fluorescence image of a mouse injected with FH(ICG) and imaged after 5 days using IVIS (E) or SIRIS (F).
Supplementary Material
Supplementary figures.
Acknowledgements
This work was supported by NIH/NIBIB grant R01 EB 019288 and internal funding from Cedars Sinai Medical Center awarded to JMP.
Supporting Information
Characterization of dye-loaded FH, additional details on FH(ICG) fluorescence characterization, fluorescence images of FH(ICG) and FH(RhB)-treated cells.
Competing Interests
The authors have declared that no competing interest exists.
References
1. Miller KD, Siegel RL, Lin CC, Mariotto AB, Kramer JL, Rowland JH. et al. Cancer treatment and survivorship statistics, 2016. CA Cancer J Clin. 2016;66:271-89
2. Zhang L, Wu B, Zha Z, Zhao H, Jiang Y, Yuan J. Positive surgical margin is associated with biochemical recurrence risk following radical prostatectomy: a meta-analysis from high-quality retrospective cohort studies. World J Surg Oncol. 2018;16:124
3. Kikuta K, Nakayama R, Yoshida A, Sasaki A, Kameyama K, Chuman H. et al. A histological positive margin after surgery is correlated with high local re-recurrence rate in patients with recurrent myxofibrosarcoma. Jpn J Clin Oncol. 2017;47:334-41
4. Sadot E, Groot Koerkamp B, Leal JN, Shia J, Gonen M, Allen PJ. et al. Resection margin and survival in 2368 patients undergoing hepatic resection for metastatic colorectal cancer: surgical technique or biologic surrogate? Ann Surg. 2015;262:476-85
5. Moran MS, Schnitt SJ, Giuliano AE, Harris JR, Khan SA, Horton J. et al. Society of Surgical Oncology-American Society for Radiation Oncology consensus guideline on margins for breast-conserving surgery with whole-breast irradiation in stages I and II invasive breast cancer. Ann Surg Oncol. 2014;21:704-16
6. Walz J, Epstein JI, Ganzer R, Graefen M, Guazzoni G, Kaouk J. et al. A Critical Analysis of the Current Knowledge of Surgical Anatomy of the Prostate Related to Optimisation of Cancer Control and Preservation of Continence and Erection in Candidates for Radical Prostatectomy: An Update. Eur Urol. 2016;70:301-11
7. Schoots IG, Petrides N, Giganti F, Bokhorst LP, Rannikko A, Klotz L. et al. Magnetic resonance imaging in active surveillance of prostate cancer: a systematic review. Eur Urol. 2015;67:627-36
8. Castellucci P, Ceci F, Graziani T, Fanti S. PET imaging in prostate cancer, state of the art: a review of 18F-choline and 11C-choline PET/CT applications. Clin Transl Imaging. 2016;4:449-56
9. Low RN, Barone RM, Lucero J. Comparison of MRI and CT for predicting the Peritoneal Cancer Index (PCI) preoperatively in patients being considered for cytoreductive surgical procedures. Ann Surg Oncol. 2015;22:1708-15
10. Greenwood HI, Freimanis RI, Carpentier BM, Joe BN. Clinical Breast Magnetic Resonance Imaging: Technique, Indications, and Future Applications. Semin Ultrasound CT MR. 2018;39:45-59
11. Clark T, Maximin S, Meier J, Pokharel S, Bhargava P. Hepatocellular Carcinoma: Review of Epidemiology, Screening, Imaging Diagnosis, Response Assessment, and Treatment. Curr Probl Diagn Radiol. 2015;44:479-86
12. Druskin SC, Macura KJ. MR Imaging for Prostate Cancer Screening and Active Surveillance. Radiol Clin North Am. 2018;56:251-61
13. de Rooij M, Hamoen EH, Futterer JJ, Barentsz JO, Rovers MM. Accuracy of multiparametric MRI for prostate cancer detection: a meta-analysis. Am J Roentgenol. 2014;202:343-51
14. Ahmed HU, El-Shater Bosaily A, Brown LC, Gabe R, Kaplan R, Parmar MK. et al. Diagnostic accuracy of multi-parametric MRI and TRUS biopsy in prostate cancer (PROMIS): a paired validating confirmatory study. Lancet. 2017;389:815-22
15. Wei H, Bruns OT, Kaul MG, Hansen EC, Barch M, Wisniowska A. et al. Exceedingly small iron oxide nanoparticles as positive MRI contrast agents. Proc Natl Acad Sci U S A. 2017;114:2325-30
16. McDonagh BH, Singh G, Hak S, Bandyopadhyay S, Augestad IL, Peddis D. et al. L-DOPA-Coated Manganese Oxide Nanoparticles as Dual MRI Contrast Agents and Drug-Delivery Vehicles. Small. 2016;12:301-6
17. Shen Z, Wu A, Chen X. Iron Oxide Nanoparticle Based Contrast Agents for Magnetic Resonance Imaging. Mol Pharm. 2017;14:1352-64
18. Santra S, Kaittanis C, Grimm J, Perez JM. Drug/dye-loaded, multifunctional iron oxide nanoparticles for combined targeted cancer therapy and dual optical/magnetic resonance imaging. Small. 2009;5:1862-8
19. Thawani JP, Amirshaghaghi A, Yan L, Stein JM, Liu J, Tsourkas A. Photoacoustic-Guided Surgery with Indocyanine Green-Coated Superparamagnetic Iron Oxide Nanoparticle Clusters. Small. 2017:13
20. Ning P, Zucker EJ, Wong P, Vasanawala SS. Hemodynamic safety and efficacy of ferumoxytol as an intravenous contrast agents in pediatric patients and young adults. Magn Reson Imaging. 2016;34:152-8
21. Bashir MR, Bhatti L, Marin D, Nelson RC. Emerging applications for ferumoxytol as a contrast agent in MRI. J Magn Reson Imaging. 2015;41:884-98
22. Toth GB, Varallyay CG, Horvath A, Bashir MR, Choyke PL, Daldrup-Link HE. et al. Current and potential imaging applications of ferumoxytol for magnetic resonance imaging. Kidney Int. 2017;92:47-66
23. Hope MD, Hope TA, Zhu C, Faraji F, Haraldsson H, Ordovas KG. et al. Vascular Imaging With Ferumoxytol as a Contrast Agent. Am J Roentgenol. 2015;205:W366-73
24. Kaittanis C, Shaffer TM, Ogirala A, Santra S, Perez JM, Chiosis G. et al. Environment-responsive nanophores for therapy and treatment monitoring via molecular MRI quenching. Nat Commun. 2014;5:3384
25. Kaittanis C, Bolaender A, Yoo B, Shah N, Ouerfelli O, Grimm J. Targetable Clinical Nanoparticles for Precision Cancer Therapy Based on Disease-Specific Molecular Inflection Points. Nano Lett. 2017;17:7160-8
26. Alam IS, Steinberg I, Vermesh O, van den Berg NS, Rosenthal EL, van Dam GM. et al. Emerging Intraoperative Imaging Modalities to Improve Surgical Precision. Mol Imaging Biol. 2018;20:705-15
27. Huang X, Song J, Yung BC, Huang X, Xiong Y, Chen X. Ratiometric optical nanoprobes enable accurate molecular detection and imaging. Chem Soc Rev. 2018;47:2873-920
28. van Dam GM, Themelis G, Crane LM, Harlaar NJ, Pleijhuis RG, Kelder W. et al. Intraoperative tumor-specific fluorescence imaging in ovarian cancer by folate receptor-alpha targeting: first in-human results. Nat Med. 2011;17:1315-9
29. Troyan SL, Kianzad V, Gibbs-Strauss SL, Gioux S, Matsui A, Oketokoun R. et al. The FLARE intraoperative near-infrared fluorescence imaging system: a first-in-human clinical trial in breast cancer sentinel lymph node mapping. Ann Surg Oncol. 2009;16:2943-52
30. Mamelak A, Butte P, Kittle D, Parrish-Novak J, Perry J, Miller D. et al. Clinical Translation of a Novel Video Imaging System for near-Infrared Fluorescence Guided Resection of Brain Tumors. Neuro-Oncology. 2015;17:218 -
31. Hong GS, Antaris AL, Dai HJ. Near-infrared fluorophores for biomedical imaging. Nat Biomed Eng. 2017;1:0010
32. Owens EA, Lee S, Choi J, Henary M, Choi HS. NIR fluorescent small molecules for intraoperative imaging. Wiley Interdiscip Rev Nanomed Nanobiotechnol. 2015;7:828-38
33. Maeda H, Nakamura H, Fang J. The EPR effect for macromolecular drug delivery to solid tumors: Improvement of tumor uptake, lowering of systemic toxicity, and distinct tumor imaging in vivo. Adv Drug Deliv Rev. 2013;65:71-9
34. Blanco E, Shen H, Ferrari M. Principles of nanoparticle design for overcoming biological barriers to drug delivery. Nat Biotechnol. 2015;33:941-51
35. Storey P, Lim RP, Chandarana H, Rosenkrantz AB, Kim D, Stoffel DR. et al. MRI assessment of hepatic iron clearance rates after USPIO administration in healthy adults. Invest Radiol. 2012;47:717-24
36. Kato Y, Ozawa S, Miyamoto C, Maehata Y, Suzuki A, Maeda T. et al. Acidic extracellular microenvironment and cancer. Cancer Cell Int. 2013;13:89
37. Ackerman D, Simon MC. Hypoxia, lipids, and cancer: surviving the harsh tumor microenvironment. Trends Cell Biol. 2014;24:472-8
38. Dai Y, Xu C, Sun X, Chen X. Nanoparticle design strategies for enhanced anticancer therapy by exploiting the tumour microenvironment. Chem Soc Rev. 2017;46:3830-52
39. Jensen KH, Berg RW. CLARITY-compatible lipophilic dyes for electrode marking and neuronal tracing. Sci Rep. 2016;6:32674
40. Landsman ML, Kwant G, Mook GA, Zijlstra WG. Light-absorbing properties, stability, and spectral stabilization of indocyanine green. J Appl Physiol. 1976;40:575-83
41. Li N, Li T, Hu C, Lei X, Zuo Y, Han H. Targeted Near-Infrared Fluorescent Turn-on Nanoprobe for Activatable Imaging and Effective Phototherapy of Cancer Cells. ACS Appl Mater Interfaces. 2016;8:15013-23
42. Hill TK, Abdulahad A, Kelkar SS, Marini FC, Long TE, Provenzale JM. et al. Indocyanine green-loaded nanoparticles for image-guided tumor surgery. Bioconjug Chem. 2015;26:294-303
43. Kraft JC, Ho RJ. Interactions of indocyanine green and lipid in enhancing near-infrared fluorescence properties: the basis for near-infrared imaging in vivo. Biochemistry. 2014;53:1275-83
44. Pansare VJ, Faenza WJ, Lu H, Adamson DH, Prud'homme RK. Formulation of long-wavelength indocyanine green nanocarriers. J Biomed Opt. 2017;22:1-11
45. Ramanathan RK, Korn RL, Raghunand N, Sachdev JC, Newbold RG, Jameson G. et al. Correlation between Ferumoxytol Uptake in Tumor Lesions by MRI and Response to Nanoliposomal Irinotecan in Patients with Advanced Solid Tumors: A Pilot Study. Clin Cancer Res. 2017;23:3638-48
46. Newton AD, Kennedy GT, Predina JD, Low PS, Singhal S. Intraoperative molecular imaging to identify lung adenocarcinomas. J Thorac Dis. 2016;8:697-704
47. Okusanya OT, Holt D, Heitjan D, Deshpande C, Venegas O, Jiang J. et al. Intraoperative near-infrared imaging can identify pulmonary nodules. Ann Thorac Surg. 2014;98:1223-30
48. Wang HQ, Hu PF, Zheng Y, Zhao Z, Zheng B, Chang J. et al. Construction of ICG encapsulated W18O49@MSN as a fluorescence carrier for real-time tracked photothermal therapy. Mater Sci Eng C Mater Biol Appl. 2017;80:102-9
49. Luo T, Qian X, Lu Z, Shi Y, Yao Z, Chai X. et al. Indocyanine Green Derivative Covalently Conjugated with Gold Nanorods for Multimodal Phototherapy of Fibrosarcoma Cells. J Biomed Nanotechnol. 2015;11:600-12
50. Bahmani B, Guerrero Y, Bacon D, Kundra V, Vullev VI, Anvari B. Functionalized polymeric nanoparticles loaded with indocyanine green as theranostic materials for targeted molecular near infrared fluorescence imaging and photothermal destruction of ovarian cancer cells. Lasers Surg Med. 2014;46:582-92
51. Holt D, Okusanya O, Judy R, Venegas O, Jiang J, DeJesus E. et al. Intraoperative near-infrared imaging can distinguish cancer from normal tissue but not inflammation. PLoS One. 2014;9:e103342
52. Song G, Petschauer JS, Madden AJ, Zamboni WC. Nanoparticles and the mononuclear phagocyte system: pharmacokinetics and applications for inflammatory diseases. Curr Rheumatol Rev. 2014;10:22-34
53. Meijer DK, Weert B, Vermeer GA. Pharmacokinetics of biliary excretion in man. VI. Indocyanine green. Eur J Clin Pharmacol. 1988;35:295-303
54. Geisser P, Burckhardt S. The pharmacokinetics and pharmacodynamics of iron preparations. Pharmaceutics. 2011;3:12-33
55. Saxena V, Sadoqi M, Shao J. Polymeric nanoparticulate delivery system for Indocyanine green: biodistribution in healthy mice. Int J Pharm. 2006;308:200-4
56. Bahmani B, Lytle CY, Walker AM, Gupta S, Vullev VI, Anvari B. Effects of nanoencapsulation and PEGylation on biodistribution of indocyanine green in healthy mice: quantitative fluorescence imaging and analysis of organs. Int J Nanomedicine. 2013;8:1609-20
Author contact
![]() Corresponding author: Email: jmanuel.perezorg
Corresponding author: Email: jmanuel.perezorg
Citation styles
APA
Reichel, D., Tripathi, M., Butte, P., Saouaf, R., Perez, J.M. (2019). Tumor-Activatable Clinical Nanoprobe for Cancer Imaging. Nanotheranostics, 3(2), 196-211. https://doi.org/10.7150/ntno.34921.
ACS
Reichel, D.; Tripathi, M.; Butte, P.; Saouaf, R.; Perez, J.M. Tumor-Activatable Clinical Nanoprobe for Cancer Imaging. Nanotheranostics 2019, 3 (2), 196-211. DOI: 10.7150/ntno.34921.
NLM
Reichel D, Tripathi M, Butte P, Saouaf R, Perez JM. Tumor-Activatable Clinical Nanoprobe for Cancer Imaging. Nanotheranostics 2019; 3(2):196-211. doi:10.7150/ntno.34921. https://www.ntno.org/v03p0196.htm
CSE
Reichel D, Tripathi M, Butte P, Saouaf R, Perez JM. 2019. Tumor-Activatable Clinical Nanoprobe for Cancer Imaging. Nanotheranostics. 3(2):196-211.
This is an open access article distributed under the terms of the Creative Commons Attribution (CC BY-NC) license (https://creativecommons.org/licenses/by-nc/4.0/). See http://ivyspring.com/terms for full terms and conditions.