- Volume 10; 2026
- Volume 9; 2025
- Volume 8; 2024
- Volume 7; 2023
- Volume 6; 2022
- Archive
- Editorial Board
- Cover Suggestion
- Index & Coverage
- Special Issues
Introduction
Results
Discussion
Materials and Methods
Abbreviations
Acknowledgements
Supplementary Material
References
International Journal of Biological Sciences
International Journal of Medical Sciences

 Global reach, higher impact
Nanotheranostics 2018; 2(4):320-346. doi:10.7150/ntno.23826 This issue Cite
Research Paper
Targeting Somatostatin Receptors By Functionalized Mesoporous Silica Nanoparticles - Are We Striking Home?
Valeriy M Paramonov1,2,4, Diti Desai3, Helene Kettiger3, Veronika Mamaeva2,4†, Jessica M Rosenholm3, Cecilia Sahlgren2,4,5 ![]() , Adolfo Rivero-Müller1,2,4,6
, Adolfo Rivero-Müller1,2,4,6 ![]()
1. Institute of Biomedicine, Research Centre for Integrative Physiology and Pharmacology, University of Turku, Finland
2. Turku Centre for Biotechnology, University of Turku and Åbo Akademi University, Finland
3. Pharmaceutical Sciences Laboratory, Faculty of Science and Engineering, Åbo Akademi University, Finland
4. Faculty of Science and Engineering, Cell Biology, Åbo Akademi University, Finland
5. Institute for Complex Molecular Systems, Eindhoven University of Technology, Eindhoven, The Netherlands
6. Department of Biochemistry and Molecular Biology, Medical University of Lublin, Poland.
† Deceased 06 January 2018
Received 2017-11-17; Accepted 2018-6-25; Published 2018-7-12
Abstract

The concept of delivering nanoformulations to desired tissues by means of targeting membrane receptors of high local abundance by ligands anchored to the nanocarrier has gained a lot of attention over the last decade. Currently, there is no unanimous opinion on whether surface functionalization of nanocarriers by targeting ligands translates into any real benefit in terms of pharmacokinetics or treatment outcomes. Having examined the published nanocarriers designed to engage with somatostatin receptors, we realized that in the majority of cases targetability claims were not supported by solid evidence of targeting ligand-targeted receptor coupling, which is the very crux of a targetability concept. Here, we present an approach to characterize targetability of mesoporous silica-based nanocarriers functionalized with ligands of somatostatin receptors. The targetability proof in our case comes from a functional assay based on a genetically-encoded cAMP probe, which allows for real-time capture of receptor activation in living cells, triggered by targeting ligands on nanoparticles. We elaborate on the development and validation of the assay, highlighting the power of proper functional tests in the characterization pipeline of targeted nanoformulations.
Keywords: targeted nanoparticles/nanopharmaceuticals, targetability, ligand-receptor interaction, somatostatin receptor, cAMP, mesoporous silica.
Introduction
The concept of active targeting of nanoformulations, implying enhanced selectivity and uptake of nanoparticles (NPs) by desired tissues by means of surface functionalization of NPs with high affinity ligands to the membrane receptors in the target tissues (hence, the terms targetability/targeting), has been in the spotlight of nanobiotechnology for more than a decade [1-3]. The described approach promises both improved overall delivery rate and enhanced tissue selectivity - and, indeed, the field has recently witnessed successful stories of nanoformulations designed to target desired tissue by engaging the receptors of high local abundance [4-7]. Yet, despite advancements in material science and numerous attempts to improve NP design, including quite sophisticated ways of NP surface functionalization, e.g. by employing divergent charge for repulsion or attraction, varying protective groups and shells for enhancing NP circulation times and avoiding immune surveillance [8,9], the problem of active targeting verification persists. Inspired by the targetability concept and the expected benefits of NP functionalization with high affinity ligands, we set off to develop a targeted nanocarrier for cancer research. To allow for effective drug loading, the general design chosen was a mesoporous silica (MeSi)-based nanocarrier decorated with peptide ligands to somatostatin receptors (SSTRs), members of the G protein-coupled receptor (GPCRs) family, known to be overexpressed in a variety of malignancies, including breast cancer, prostate cancer and selected neuroendocrine neoplasias of the gut [10,11].
Before starting the project, we outlined the following three principal pieces of evidence that together constitute the minimum requirements for validation of targetability of a given nanocarrier, both in vitro and in vivo settings. Firstly, the system employed for testing of NPs should have targeted receptors in a functional state, able to bind and respond to the targeting moiety. Secondly, the ligands need to be anchored to NPs in the correct orientation and the final formulation should not contain detectable levels of free non-conjugated ligands admixed. Thirdly, the interaction between the targeting moiety anchored to the surface of NPs and the targeted receptor in the testing system needs to be verified. The interaction should occur in the expected affinity range and produce the expected outcome in terms of receptor state (if any), e.g. change of receptor conformation with ensuing signal relay, internalization, trafficking.
Noteworthy, the introduced tripartite targetability validation framework is universal and thus should be applicable to virtually every nanoparticulate system devised for active receptor targeting, irrespectively of the given design of a nanoformulation and nature of a target. Indeed, whatever the biology of the membranous receptor is, it has to be present in the system under scrutiny to be available for coupling with targeting ligands. Exact structure of a receptor and the nature of recognized molecules, as well as «receptor behavior» upon coupling with ligands (i.e., any downstream signaling, recruitment of scaffold proteins or other membranous receptors, receptor internalization with subsequent trafficking, degradation or re-shuttling to plasma membrane) are of no relevance in this regard. Complementary to this, a nanoformulation used has to be appropriately decorated with targeting moieties. Ultimately, experimental validation of the coupling event with a suitable technique makes a final prerequisite for a targetability statement.
Mindful of the described NP targetability validation framework, we consulted the literature to ensure the suggested approach complies with the mode of targetability validation in other studies. We focused on octreotide, a well-characterized agonist of SSTR2 and SSTR5, which has an excellent track record of more than several decades both in basic research and in the clinic [12,13], and searched for the papers on any nanosystems functionalized with this octapeptide for SSTR targeting. The search procured 18 separate studies on various nanocarriers functionalized with octreotide or its close derivatives (Table 1) - and just one out of the published octreotide-functionalized nanosystems was characterized in full compliance with the above tripartite targetability validation scheme. Though virtually all the NPs have been comprehensively characterized after peptide functionalization by physico-chemical means, only 5 out of 18 (5/18) projects involved assays for the targeted receptor abundance in the system intended for NP testing. What is more, only two studies out of 18 (2/18) demonstrated the interaction of NP-bound targeting ligands with the targeted receptors. The conclusions on the targetability in the 16 remaining studies were based on differential behavior of peptide-tagged versus control NPs in a testing system, namely on discrepant internalization rates of NPs and/or their effects of cell viability. In selected cases, targetability claims were further corroborated by competition experiment with either excess of free ligand or a receptor-blocking antibody.
Selected published nanoformulations intended for SSTR targeting
| Nanocarrier and its size* | Targeting moiety** | Targeted receptor abundance in a testing model?*** | Solid evidence of interaction between targeting ligands and targeted receptors (TL-TR) in a testing model provided? | Refs |
|---|---|---|---|---|
| Liposomes; 115±2 nm | Octreotide (2>5~3) | Acceptable: qRT-PCR coupled with GFP imaging (SSTR2-IRES-GFP construct) | NO: conclusions on TL-TR are based on differential cell binding/internalization rates of octreotide-tagged and bare NPs | Pharm. Res. (2013) [14] |
| Liposomes; 101-156 nm | Octreotide (2>5~3) | Not done: referral to an earlier paper from the other lab | NO: conclusions on TL-TR are based on differential cellular uptake of octreotide-tagged and bare NPs | Food Chem. Toxicol. (2008) [15] |
| Liposomes; 90-100 nm | Octreotide (2>5~3) | Not done: referral to earlier papers from other labs | NO: conclusions on TL-TR are based on differential cellular uptake of octreotide-tagged and bare NPs | Pharm. Res. (2012) [16] |
| Liposomes; 134-154 nm | Octreotide (2>5~3) | Not done: referral to earlier papers from other labs | NO: conclusions on TL-TR are based on differential uptake rates of targeted and control NPs, corroborated with competition experiments | Mol. Pharm. (2011) [17] |
| Liposomes; 116-123 nm | Octreotate ([Tyr3]-TATE) (2>>5~3) | Acceptable: qRT-PCR for SSTR2, absolute quantitation (transcript numbers were related to data from SSTR-positive clinical samples) | NO: conclusions on TL-TR are based on differential cellular uptake of octreotate-tagged and bare NPs | J. Control. Release (2012) [18] |
| Liposomes; ca 110 nm | Octreotide (2>5~3) | Not done: referral to an earlier paper from the other lab | NO: conclusions on TL-TR are based on differential cellular uptake and cytotoxicity of octreotide-tagged and bare NPs | Nanotechnology (2010) [19] |
| Liposomes; ca 100 nm | Octreotide (2>5~3) | Acceptable: the cell lines were characterized for SSTR2 by WB and ICH | NO: conclusions on TL-TR are based on differential cellular uptake (including competition with free ligand and anti-SSTR2 antibody) and cytotoxicity of octreotide-tagged and bare NPs**** | Mol. Pharm. (2010) [20] |
| Micelles; 210-240 nm | Octreotide (2>5~3) | Not done | NO: conclusions on TL-TR are based on differential cellular uptake (including competition with free ligand) and cytotoxicity of octreotide-tagged and bare NPs | Biomaterials (2012) [21] |
| Micelles; ca 66 nm | Octreotide (2>5~3) | Not done | NO: conclusions on TL-TR are based on differential cellular uptake of octreotide-tagged and bare NPs | Biomaterials (2016) [22] |
| Micelles; ca 70 nm | Octreotide (2>5~3) | Not done | NO: conclusions on TL-TR are based on differential cellular uptake of octreotide-tagged and bare NPs | Nanoscale (2013) [23] |
| Micelles; 50-75 nm | Octreotide (2>5~3) | Not done | NO: conclusions on TL-TR are based on differential cellular uptake of octreotide-tagged and bare NPs | Pharm. Res. (2011) [24] |
| Micelles; 100-140 nm | Octreotide (2>5~3) | Not done | NO: conclusions on TL-TR are based on differential cellular uptake (including competition with the excess of free ligand) and cytotoxicity of octreotide-tagged and bare NPs | J. Pharm. Sci. (2012) [25] |
| 1) Micelles; ca 20 nm 2) Liposomes; ca 100 nm | Tyrosine-3-octreotide (2>5>3) | Not done | YES: in a competitive binding experiment on isolated AR42J membranes both types of the nanovehicles functionalized with the «cold» (non-radioactive) targeting ligand were able to displace «hot» (radioactive) free SST14, with IC50 of both NPs being in the low nanomolar range. | Nanomedicine Nanotech. Biol. Med. (2012) [26] |
| Nanostructured lipid carriers; 100-125 nm | Octreotide (2>5~3) | Not done | NO: conclusions on TL-TR are based on differential internalization rates observed between NPs with varying octreotide surface load, supported by competition assay with the excess of free octreotide and assays with inhibitors of different endocytosis pathways | Int. J. Pharm. (2013) [27] |
| Gold nanorods; 50x10 nm (TEM) | Octreotide (2>5~3) | Not done | NO: conclusions on TL-TR are based on differential cellular uptake of octreotide-tagged and bare NPs | Nanoscale (2012) [28] |
| 1) Dendrimers; ca 1.5 nm 2) Gold NPs; ca 20 nm | Tyrosine-3-octreotide (2>5>3) | Not done | NO: conclusions on TL-TR are based on differential cellular uptake (including competition with the excess of free ligand in vivo) of Tyr3-octreotide-tagged and bare NPs | J. Nanosci. Nanotechnol. (2015) [29] |
| Iron oxide NPs; ca 10 nm (TEM) | Octreotide (2>5~3) | Acceptable: the cell line used was characterized for SSTRs by RT-PCR and ICH | NO: conclusions on TL-TR are based on differential cellular uptake of octreotide-tagged and bare NPs (including competition with the excess of free ligand) | Acta Radiologica. (2009) [30] |
| Branched block copolymer NPs; ca 40 nm | Octreotide (2>5~3) | Acceptable: the authors utilized CHO cell line with stable overexpression of SSTR2 for TL-TR validation in vitro, though the actual data on receptor expression is not included in the paper | YES: in a competitive binding experiment on isolated membranes of CHO cells with stable overexpression of SSTR2 targeting ligand- functionalized NPs were able to displace [125I]- SST14, with Ki of targeted NPs studied being close to or lower than Ki of free SST14 | Biomacro- molecules. (2016) [31] |
* DLS-derived dimensions of NPs are shown, if not stated otherwise.
** SSTR subtypes with the highest affinity to the ligand in question are listed; for more explicit data on affinity of various ligands to different SSTR subtypes refer to Table S1.
*** All the studies listed employed cell lines for targetability validation of NPs. In case of plasma membrane - confined receptors such as SSTRs an appropriate characterization implies providing evidence of SSTR presence on a protein level. Ideally, the technique used should give some idea of receptor abundance (quantitative or semi-quantitative), thus allowing for comparison with other model systems, and unequivocally demonstrate that the targeted receptor resides in a proper cellular compartment (i.e., membranous proteins remain plasma membrane-bound and are not in the cytoplasm). Immunolabelling with microscopy revealing membranous pattern of targeted receptor distribution makes a good example of a pertinent technique.
**** For the competition experiment the authors preincubated viable non-permeabilized cells with anti-SSTR2 primary antibody that recognizes intracellular epitope of the receptor (anti-SSTR2 goat polyclonal IgG from SantaCruz; #sc11606), which in essence renders it a non-specific protein (no access to epitope). Most surprisingly, this set-up brought the uptake of targeted NPs down to the level of bare NPs, pointing out that the earlier observed benefit in uptake of targeted NPs over bare NPs most probably was not mediated by specific interaction of NP-bound ligands with SSTRs on targeted cells, contrary to the authors` claim of targetability.
DLS - dynamic light scattering; ICH - immunocytochemistry; Ki - inhibition constant; qRT-PCR - quantitative (real-time) reverse transcription polymerase chain reaction; TEM - transmission electron microscopy; WB - Western blotting.
Appropriate testing systems for verification of receptor-ligand interaction will constitute a significant advancement of targeted nanopharmaceutics. Entry of NPs into the cells with ensuing cargo release and consequent cellular responses (e.g., toxicity) are phenomenological in nature and cannot serve as evidence for targetability. Targeted NPs may demonstrate altered internalization rates or toxicity due to effects of a targeted moiety on their net surface charge and/or protein adsorption, with the resulting changes affecting the propensity of a nanosystem to adhere and traverse through cell membranes. Without solid evidence of ligand-receptor interaction, all these observations leave no grounds for a targetability statement.
As an example of an approach for targetability validation, we present a set of in-house synthesized mesoporous silica nanoparticles decorated with selected ligands of SSTRs. In accordance with the tripartite rules of targetability presented above, we demonstrate (1) the presence of targeting ligands on the surface of NPs, (2) the expression of targeted receptors on membranes of the cells exposed to NPs, and verify (3) the interaction between NP-anchored ligands and targeted receptors in acceptor cells. For the latter purpose, we introduce a highly sensitive assay based on a genetically-encoded probe, which allows for real-time observation of SSTR signaling in living cells, triggered by targeting ligands on the surface of NPs. We discuss the capabilities and limitations of this assay, highlighting the power of a proper functional test in the NP characterization pipeline.
Results
SSTR signaling and selection of a functional assay for targeting ligand - targeted receptor interaction
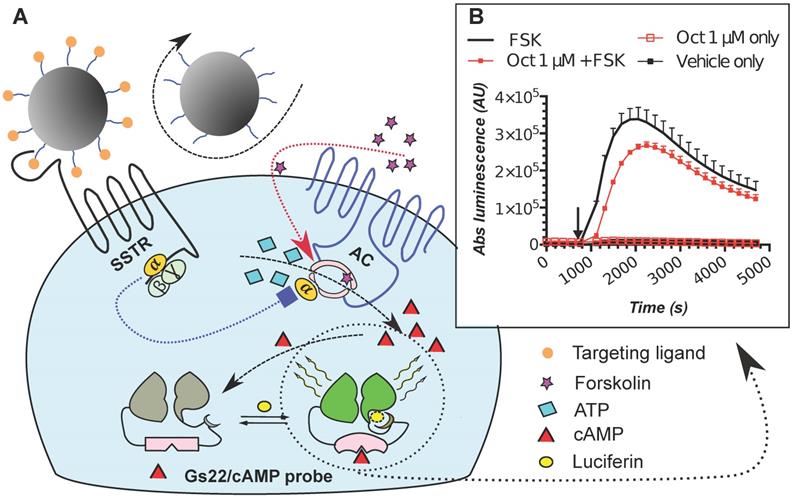
To mimic the physiologic environment of NP-cell interactions we used a live cell-based assay for studies of targeting peptide-SSTR coupling. All five subtypes (1-5) of SSTRs described in humans represent GPCRs coupled with Gαi and hence act as negative regulators of adenylyl cyclases (ACs), inhibiting intracellular generation of 3′-5′-cyclic adenosine monophosphate (cAMP; Figure 1A). Other universal signaling effects triggered by all SSTR subtypes upon activation include recruitment of guanosine-5'-triphosphate molecules (GTP) by Gαi, activation of selected tyrosine phosphatases and activation of membranous potassium channels [10,32]. We decided to focus on intracellular cAMP due to the prolonged duration of the response (on minutes scale), the amplification of the signal downstream of SSTRs and the availability of cAMP probes suitable for cAMP tracing in living cells [33]. For the latter, we selected a luminescent genetically-encoded probe for cAMP, GloSensor-22F (Gs22/cAMP), originally developed by Wood and co-authors [34]. Based on a circularly permutated luciferase of Photinus pyralis fused with a regulatory subunit IIβ of protein kinase A, which acts as cAMP responsive element, the sensor molecule restores enzymatic activity upon cAMP binding, with subsequent light emission in the presence of luciferin (Figure 1A). With sensitivity over a broad range of cAMP concentrations (0.003—100 µM) and an excellent linearity of response, Gs22/cAMP provides for an up to 800-fold signal-to-noise ratio, faithfully capturing real-time cAMP oscillations in both transiently and stably transfected cell lines, as well as primary cultures [35,36].
SSTR signaling and operational principles of Gs22/cAMP probe. (A) Targeting ligands (NP-anchored or free; orange bubbles) bind and activate SSTRs, which results in inhibition of AC activity by liberated Gαi subunits (negative regulation of cAMP levels - blue dotted line). FSK freely traverses plasma membrane and lands in the catalytic pocket of AC, boosting cAMP generation (positive regulation of cAMP levels - red dotted line). SSTR firing on top of the stimulatory effect of FSK leads to a relative drop in cAMP levels, as compared to treatment with FSK only. Sizable oscillations of cAMP levels are captured by Gs22/cAMP probe, which regains enzymatic activity upon cAMP binding, leading to light emission in the presence of luciferin, with the signal intensity proportional to net cAMP levels. (B) High-dose octreotide (1 μM) triggers cAMP inhibition in HEK-Gs cells. The signal from the cells exposed to octreotide in combination with FSK had lower amplitude than the signal from the cells treated with FSK only, signifying the negative regulation of ACs via octreotide-activated SSTRs. Of note, cells exposed to either solvent or 1 μM of octreotide without concurrent addition of FSK did not exhibit any significant alterations in cAMP levels. The Gs22/cAMP assay was run at standard conditions (at RT, 200 μM of IMBX and 10 μM of FSK); the black arrow indicates the time of treatment initiation. Luminescence curves from a single representative experiment in 3x technical replicates (mean values + upper half of SD are shown) are presented; x-axis denotes time scale (s), y-axis denotes non-normalized light output values (AU).
To probe SSTR activation by ligands of interest, we chose two human cells lines, HEK293 and BON1, earlier reported to express SSTRs. Data on SSTR expression in HEK293 cells (SSTR2/3/4/5-positive) primarily comes from gene expression databases (GENEVESTIGATOR; queried at https://genevestigator.com/gv/ on 07.06.2017), whilst BON1, originally established from pancreatic endocrine carcinoma (a neoplasia renowned for SSTR abundance), have been shown to express SSTR2 and 5 on a protein level in several independent studies [37-40].
In order to boost the sensitivity and resolution of cAMP measurements, as well as to minimize inter-run variation due to differences in transfection efficacy, we derived stable cell lines overexpressing the reporter probe Gs22/cAMP from the maternal wild-type cultures of HEK293 and BON1, denoted as HEK-Gs and BON-Gs respectively. HEK-Gs and BON-Gs cells served as reliable tools for capture of positive increments in intracellular cAMP triggered by various stimuli, including certain agonists of GPCRs and forskolin (FSK), a potent non-specific activator of ACs (Figure S1).
Activation of SSTRs by agonists normally results in inhibition of cAMP production by ACs. This inhibitory effect of SSTRs might not produce any sizable changes in cAMP levels if ACs are in the state of minimal enzymatic activity, which is most typical for non-perturbed cells. Hence, SSTR activation is likely to leave no footprint in terms of cAMP and go unnoticed under these conditions (Figure 1B, octreotide 1 μM only curve). In order to avoid this pitfall, the activity of GPCRs that signal via Gαi can be measured in the state of pre-activated ACs, which can be achieved by either FSK or agonists of GPCRs positively coupled to ACs via Gαs [41-44]. Activation of SSTRs during continuous cAMP generation by ACs results in cessation of cAMP production, producing a sizable drop in cAMP levels due to concerted activity of phosphodiesterases (PDEs). In terms of the Gs22/cAMP assay, this is reflected in decreased light output from the cells treated with an activator of ACs together with SSTR agonist as opposed to cells exposed to the activator of ACs only, signifying depletion of intracellular cAMP stores in the former. We observed the expected inhibitory effects of SSTR agonists on luminescence when the agonists were added to the cells together with FSK (Figure 1B). Subsequent optimization runs with HEK-Gs and BON-Gs cells demonstrated that 10 μM of FSK is the concentration triggering the most potent cAMP elevation and thus allowing for the best resolving window in the assay (Figure S1A-B). Thus, we routinely employed 10 μM FSK in Gs22/cAMP assay for studies of SSTR agonists, either in a free state or bound to NPs.
Cells with low expression of SSTRs constitute a poor model for quantitative characterization of targetability
Subsequent dose-effect studies demonstrated that HEK-Gs and BON-Gs are poor overall responders to octreotide, as cAMP inhibition was only detected with high doses of the peptide. We observed a remarkably similar cAMP response in both cell lines: sizable though modest cAMP depletion was evident from 500 nM octreotide onwards, whilst treatment with low concentrations (1-10 nM) of octreotide appeared to induce a moderate rise in peak cAMP levels, leaving the signal kinetics otherwise unchanged (Figure S2).
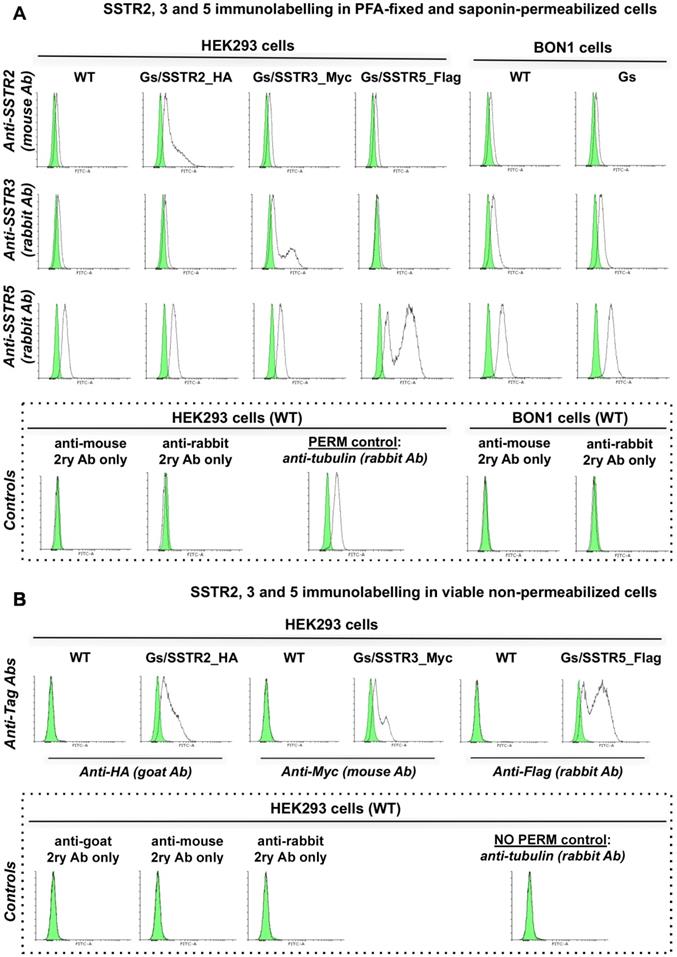
The poor activity of octreotide in HEK-Gs and BON-Gs can be explained by the low abundance of SSTR2, 3 and 5 in these cells, as revealed by flow cytometry (FC) analysis (Figure 2). In contrast to the earlier published SSTR profiles (BON1 cells have been reported to carry high protein levels of SSTR2 and 5, and HEK293 cells to have moderate levels of SSTR2/3/5 transcripts), BON1 cells exhibited very low and low expression of SSTR3 and SSTR5, respectively, but had virtually no SSTR2. The receptor profile in HEK293 was very similar to the one of BON1 cells, but with even lower levels of SSTR3 and 5. Importantly, levels of SSTR2, 3 and 5 remained unaffected in cells with stable overexpression of Gs22 probe, which allows to exclude artificial shift in SSTR profile due to transgene introduction and selection procedures (Figure 2A).
SSTR2, 3 and 5 expression in cell lines employed in the study: indirect immunolabelling in a flow cytometry analysis. SSTR2, 3 and 5 immunolabelling results in paraformaldehyde (PFA)-fixed and saponin-permeabilized HEK293 and BON1 cells, along with matched control stains in viable non-permeabilized HEK293 cells are presented on panels A and B, respectively. As all the anti-SSTR antibodies (Abs) employed in the series on panel A target native epitopes within C-tails of the receptors (confined to cytoplasmic compartment), the cells were fixed with PFA and permeabilized with saponin before immunolabelling. Conversely, the immunolabelling of the cells on panel B involved primary Ab against distinct tags within extracellular N-termini of SSTRs, hence no permeabilization was required and the staining was done on viable non-permeabilized cells. Noteworthy, the pattern of signal from matched samples stained for the same target with Abs against its different epitopes (Abs to intracellular C-tails of receptors on panel A vs Abs to tags within extracellular domains of the same receptors on panel B) is almost identical, which signifies specificity of the data. Bimodal appearance of the populations on histograms, especially obvious in case of SSTR3- and 5-overexpressing cells, is explained by the oligoclonal nature of the cultures, with the resulting distribution being formed by progeny of two (or more) dominant clones. Staining for β-tubulin, a component of a cytoskeleton, on panels A and B was implemented as a positive or negative control of permeabilization, respectively. The cells were analyzed on LSRII cytometer; at least 15 000 of the gated events were captured. Every image represents an overlay histogram of two samples: black transparent charts stand for either non-stained controls or fully stained samples; shaded green charts reflect the corresponding secondary antibody - only stained controls. x-axis denotes sample emission [(505 nm longpass)/(530/30 nm bandpass)] upon stimulation with 488 nm laser; y-axis indicates the number of events registered. The data from a single representative experiment (performed in duplicate) is shown; the complete series has been independently performed at least three times.
The described receptor profile matches the results of the octreotide-cAMP studies. The relatively low abundance of SSTR5 and 3, combined with their less potent cAMP inhibitory response to octreotide as compared with SSTR2 [45], explain the modest amplitude of cAMP changes that we observed with octreotide treatment (Figure S2).
Collectively with the low-nanomolar affinity of SSTRs to agonists (Table S1), the weak responsiveness to octreotide precludes the use of HEK-Gs and BON-Gs for sensitive quantitative analyses of functionalized NP. This notion is further supported by the theoretical levels of targeting peptides in the assay's medium with NP treatment, calculated from the average peptide loads of NPs (Table 2), which appeared to be in the range of 10-200 nM of peptide (calculated as if all the NP-bound ligands were in a free state) across the expected treatment window, 1-50 μg of NPs per 1 ml of medium. To circumvent this limitation and improve the assay's sensitivity and dose resolution, we cloned and overexpressed human SSTR2, 3 and 5 in HEK-Gs and BON-Gs cells.
MeSi NPs employed in the study and their main physicochemical features.
| NP batch | Size distribution (nm), TEM | Size distribution (Z-average; nm), DLS | PDI | ζ potential (mV) | Targeting ligand | Peptide load (μg peptide per 1 mg of dry NP weight)* |
|---|---|---|---|---|---|---|
| MeSi70 | 60-70 | 402.7 +/- 8.6 | 0.29 +/-0.14 | -0.13 +/-0.63 | non-tagged | N/A |
| Cyn-MeSi70 | 60-70 | 403.8 +/-18.3 | 0.37 +/-0.01 | -7.99 +/- 5.12 | cyn-154806 | 5.6 |
| MeSi70-PEI | 60-70 | 120 | 0.13 | +46.26 +/-0.65 | non-tagged | N/A |
| Oct-MeSi70-PEI | 60-70 | 250.7 +/- 11.1 | 0.26 +/-0.03 | +23.7+/-0.32 | octreotide | 18.7 |
| MeSi250 | 250-300 | 336.5 +/-3.7 | 0.17 +/-0.05 | +1.37+/-0.02 | non-tagged | N/A |
| MeSi250-PEI | 250-300 | 375.3 +/-3.16 | 0.21 +/-0.03 | + 55.8 +/-0.87 | non-tagged | N/A |
| Oct-MeSi250-PEI | 250-300 | 619.3 +/-38.1 | 0.47 +/-0.04 | +33.6 +/-0.25 | octreotide | 20.8 |
| Sst14-MeSi250-PEI (batch#1; conjugated in MES) | 250-300 | N/M | N/M | +47.4 +/-0.7 | sst14 | 11 |
| Sst14-MeSi250-PEI (batch#2; conjugated in DMF) | 250-300 | N/M | N/M | +46.4 +/-0.87 | sst14 | 23 |
All values, apart from size distribution by TEM and peptide load for all batches of NPs, as well as Z-average and PDI for MeSi70-PEI NPs, are averages from triplicate measurements +/- SD.
*Determined by absorbance at 280 nm. N/A - not applicable; N/M - not measured; DMF - dimethylformamide; MES - 2-(N-morpholino)ethanesulfonic acid.
Cells with elevated levels of SSTRs demonstrate superior responsiveness to targeting ligands
The cultures with stable overexpression of the targeted receptors were established via transfection with in-house generated plasmids encoding human SSTR2, 3 and 5. The plasmids allowed for stoichiometric expression of a given SSTR subtype and mCherry fluorescent protein by means of the P2A linker [46], which greatly facilitated isolation of the truly positive SSTR clones by virtue of fluorescence-activated cell sorting (FACS), employing mCherry fluorescence for gating signal. Moreover, coding sequences of SSTR2, 3 and 5 were tagged (HA, Myc and Flag, respectively) at their N-termini, thus enabling us to probe for receptor abundance in transfected cultures by means of immunostaining using robust Abs against the tags (Figure S3A,B).
We decided to reserve to HEK-Gs cells as a chassis for generation of SSTR2-, 3- and 5-positive cultures, as HEK293 cells stably express high levels of SSTRs without apparent effects on cellular well-being. On the contrary, BON-Gs cells could poorly tolerate high loads of SSTR2 and 5 after transfection, with the bulk of receptor-positive cells being lost (presumably, due to cell death - data not shown) early during iterative rounds of selection and sorting. The procured oligoclonal populations of HEK-Gs cells expectedly demonstrated high abundance of SSTR2, 3 and 5, were denoted as HEK-Gs/SSTR2_HA, HEK-Gs/SSTR3_Myc and HEK-Gs/SSTR5_Flag, and used for successive experiments (Figure 2A,B).
Characterization of the double-stable cultures HEK-Gs/SSTR2_HA and HEK-Gs/SSTR5_Flag for responsiveness to varying concentrations of octreotide in Gs22/cAMP assay demonstrated the dramatic improvement in assay's performance and dose resolution. The cells with overexpressed receptors demonstrated superb sensitivity to octreotide, exhibiting a sizable decline in cAMP levels upon exposure to as low as 1 nM of free agonist (in case of SSTR2-rich cells). Moreover, HEK-Gs/SSTR2_HA and HEK-Gs/SSTR5_Flag cells provided good resolving windows for the low nanomolar and mid-nanomolar range of octreotide concentration respectively (Figure 3; compare to Figure S2A,B for octreotide response in HEK-Gs cells).
HEK-Gs/SSTR2_HA and HEK-Gs/SSTR5_Flag cells in Gs22/cAMP assay with free octreotide. (A-B) Absolute (non-normalized) luminescence signal registered in a kinetic mode in HEK-Gs/SSTR2_HA (panel A) and HEK-Gs/SSTR5_Flag (panel B) cells upon exposure to varying concentrations of octreotide in a representative experiment (in 3x technical replicates; error bars denote mean +/- SD, with only SD`s upper half shown). After capturing the baseline signal, the compounds were added to the cells (time of spiking is indicated with the black arrow) and the luminescence read was continued. y-axis indicates absolute luminescence values (AU), x-axis denotes time scale (s). (C-D) FSK-normalized and slope-corrected AUC values (%), based on luminescence signal from HEK-Gs/SSTR2_HA (panel C) and HEK-Gs/SSTR5_Flag (panel D). The raw luminescence signal from panels A and B (for SSTR2_HA and SSTR5_Flag cells respectively) was converted to FSK/slope-AUC values (%) for different concentrations of octreotide as described in Materials and Methods. Error bars represent mean +/- SD. (E) Octreotide dose - response curves in HEK-Gs/SSTR2_HA and HEK-Gs/SSTR5_Flag cells. The curves represent three (3x) independent experiments combined, with error bars showing mean +/- SEM. y-axis represents FSK/slope-AUC values (%) for the luminescence signal; x-axis denotes octreotide concentration (nM). The estimated octreotide IC50 values (with 95% CI) in SSTR2 and SSTR5 cells were 0.3 nM [0.16-0.55] and 42.5 nM [26.3-66.7], respectively. The assays were run at standard conditions (at RT, 200 μM of IMBX and 10 μM of FSK). Oct - octreotide; AUC - area under curve; IC50 - concentration of antagonist triggering half of the maximum inhibitory effect.
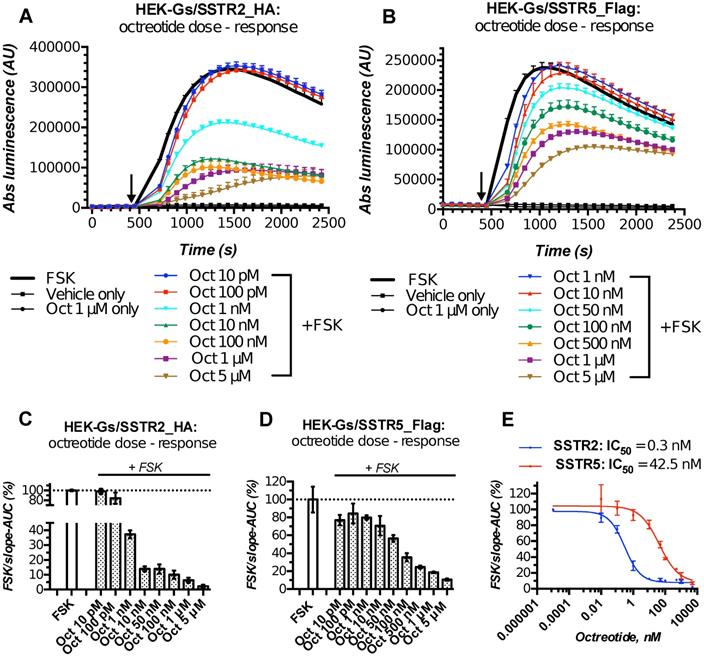
Apart from the elevated responsiveness to the agonist, the general pattern of cAMP changes upon octreotide treatment in HEK-Gs/SSTR2_HA and HEK-Gs/SSTR5_Flag cells was different. Whilst HEK-Gs/SSTR2_HA cells exhibited profound cAMP inhibition at already 1 nM of octreotide with the maximum effect achieved at 10-100 nM of the agonist, HEK-Gs/SSTR5_Flag showed a sizable drop in luminesce starting from 50 nM, with the cAMP inhibitory potency steadily rising all the way up to 5 μM of octreotide (Figure 3A-E). The described discrepancy in cAMP-inhibitory potencies of SSTR2 and SSTR5 in response to the equal doses of the same agonist is in agreement with earlier reports pointing at a more potent cAMP inhibition of octreotide via SSTR2 as opposed to SSTR5 [45], which might be related to the higher affinity of SSTR2 to octreotide (Table S1).
HEK-Gs/SSTR2_HA cells with their robust responsiveness to low nanomolar concentrations (1-10 nM) of octreotide were used in the majority of experiments. Of note, HEK-Gs/SSTR2_HA cells had comparable SSTR2 expression levels to some other non-modified cell lines, e.g. human prostate cancer cell line PC3 and human glioblastoma cell line U87-MG, which signifies physiological relevance of our testing system (Figure S4A,B). Finally, to further validate the performance of our live cell-bioassay, HEK-Gs/SSTR2_HA cells were cross-examined with a different test for cAMP, AlphaScreen cAMP assay. AlphaScreen is a homogeneous antibody-based end-point competition assay with a chemically-induced luminescent readout and as such can be used for cAMP measurements in virtually any cell type [47]. Expectedly, AlphaScreen demonstrated the same pattern of cAMP response to octreotide in HEK-Gs/SSTR2_HA cells as was earlier observed in Gs22/cAMP assay, with measurable inhibition of cAMP already noted at 10 pM of octreotide and the near-maximum inhibition achieved at 10 nM of the agonist (Figure S5). Thus, the luminescent signal in our sensor cells reflects the actual cAMP oscillations and can be reliably used for semi-quantitative probing of cAMP signaling potency of various SSTRs ligands.
Synthesis and physicochemical characterization of NPs
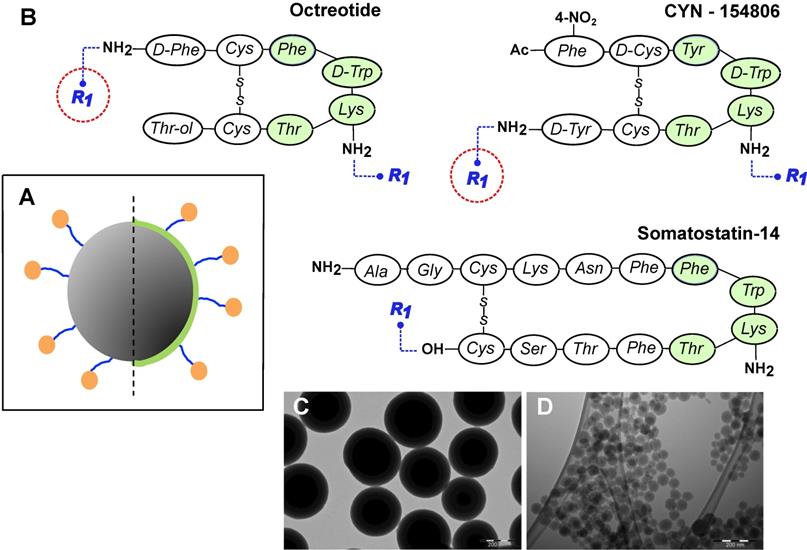
MeSi NPs were prepared and characterized as specified in Materials and Methods section. All the batches of NPs employed in the present study and their relevant characteristics are listed in Table 2. Figure 4 depicts the principal design constructs of nanoparticulate systems used, together with representative TEM images of resulting NPs.
General design of MeSi nanoparticles. (A) A schematic drawing of the targeted MeSi NPs: a big grey circle with dark-grey pits of a smaller diameter-nanoparticulate scaffold of MeSi with pores in mesoporous range; blue arms - PEG-spacer; green capping - PEI layer; orange bubbles - targeting peptides covalently attached to NP. All the NPs in the study were based on scaffolds of MeSi that were either functionalized with PEI or not. The control (non-targeted) NPs did not carry targeting peptides, but had otherwise identical structure (not shown). (B) Peptides employed for SSTR targeting. The putative pharmacophores (amino acids which appear to be crucial for effective receptor binding) are shaded with green [12,48-50]. R1 indicates PEG residue, which bridges targeting peptide to the surface of NP. As both octreotide and cyn-154806 contain a pair of amine groups (N-terminal and Lys5 for octreotide; Lys5 and C-terminal for cyn-154806), conjugation reaction with bis-NHS-PEG linker was expected to produce mixed capping of NPs, with some targeting peptides anchored via terminal amines and others via amine of Lys5. Under these conditions, only the peptides anchored via terminal amines maintain their pharmacophore exposed for receptor interaction (encircled in red). In an attempt to shift the reaction towards N-terminal amine, octreotide coupling was performed at acidic environment, taking advantage of different pKa values of terminal amine and amine group of Lys5 within the pharmacophore [51,52]. Sst14 was selectively coupled to NPs via its carboxyl group, leaving the peptide's pharmacophore unshielded. Further details on peptide conjugation strategy are provided in Materials and Methods section. (C-D) Representative TEM images of MeSi250-PEI and MeSi70-PEI scaffolds respectively; scale bar - 200 nm.
Pilot tests of NPs in Gs22/cAMP assay: general approach to testing of nanocarriers and effects of solvents
The initial screening rounds of NPs (MeSi250-PEI) with Gs22/cAMP assay produced somewhat unexpected data, as we repeatedly observed dose-dependent decline in luminescence in response to control (non-tagged) NPs, which had no targeting ligands and could not trigger SSTR-mediated cAMP inhibition (Figure 5A,D). This was attributed mostly to the effects of ethanol, the dispersion medium NPs were suspended in, on cAMP levels and related luminescence in the sensor cells exposed to NPs. Of note, all the nascent batches of NPs in this study were suspended in absolute ethanol (A-EtOH) and kept as stocks at +4°C until use [53], as MeSi-based NPs maintain structural integrity under these conditions within a period of at least 2-3 months (Figure S6). By selecting EtOH as a dispersion medium for NPs, we avoided the issue of rapid degradation of MeSi - derived materials in aqueous buffers [53], whilst maintaining batch uniformity as well as sterility between experiments. With typical NP dosing, EtOH level in working solutions of NPs without prior buffer exchange normally remains below 1,0% (v/v). Despite this low concentration, we observed sizable effects of EtOH on luminescence.
MeSi250 - PEI NPs in Gs22/cAMP assay: comparative studies of formulations with varying levels EtOH admixed and formulations that underwent buffer exchange. HEK-Gs/SSTR2_HA were treated with suspensions of MeSi250-PEI that were either directly prepared from the master stock in A-EtOH and had indicated levels of alcohol admixed (v/v; panel A), or that were subjected to buffer exchange procedure in order to prevent alcohol carry-over to the sensor cells (panel B). (C) The effects of matching levels of EtOH on the sensor cells in the same assay. (D) Integral comparison of the luminescence curves from panels A-C by means of FSK/slope - AUC values (based on 2 x independent runs combined; mean values +/- SEM). Studies with NPs having varying levels EtOH admixed suggest a dose-dependent inhibitory activity of non-tagged NPs on FSK-induced luminescence and underlying intracellular cAMP levels. However, parallel assays with the matching levels of free EtOH and purified NPs without alcohol (panels C and B respectively), reveal the true order of things: it is the inhibitory activity of EtOH on FSK response that adds up to the relatively modest and generally non-linear effects of bare NPs in sensor cells, creating a perceived pattern of a clear dose-dependent inhibitory activity of EtOH-containing nanoformulations. The assay was run at standard conditions. The compounds were added to the cells simultaneously with FSK; the moment of spiking is indicated by the black arrow. (A-C) depict luminescence curves registered in a single representative experiment performed in 3x technical replicates (mean values shown, error bars are omitted for visual clarity); x-axis denotes times scale (s), y-axis denotes non-normalized light output values (AU).
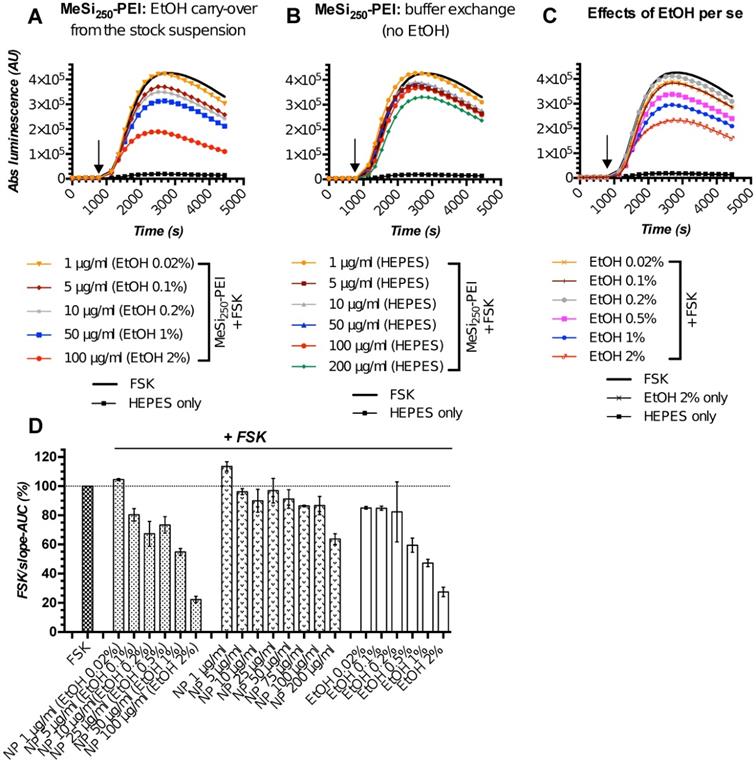
The perceived dose-dependent inhibition of signal from the sensor cells exposed to MeSi250-PEI prepared directly from the master stock in A-EtOH closely mimicked the pattern of response to corresponding levels of free EtOH across the whole range of concentrations studied (Figure 5A,C-D). However, once NPs were cleared of EtOH by buffer exchange, the signal pattern became different: at 5-50 μg/ml, MeSi250-PEI produced about equal and quite modest inhibition of FSK-induced luminescence, while treatment with higher concentrations (above 75 μg/ml) yielded somewhat more potent cAMP inhibition (Figure 5B,D). Based on this, we conclude that the signal observed with NPs prepared from the stock suspension in A-EtOH reflected the combined effects of EtOH and NPs on luminescence, roughly equaling the sum of the above factors (Figure 5D).
Further studies revealed that EtOH acts as a non-linear modifier of FSK response, which enhances cAMP output at low concentrations [0.0001 - 0.01% (v/v)], but inhibits FKS-induced luminescence at higher exposure levels (from ca 0.1% (v/v) onwards; Supplementary Information 1; Figure S7). Importantly, despite changing the resulting pattern of signal, EtOH did not interfere with inherent effects of targeting ligands and NPs on luminescence in Gs22/cAMP assay (Figure S8A-C).
As for the studies of differential effects of targeted and non-targeted NPs on intracellular cAMP stores as indirect evidence of interaction between NP-anchored targeting ligands and SSTRs, the depicted activity of EtOH does not make a significant hurdle, as long as (1) any given dose of targeted NPs is compared to a matched dose of non-targeted NPs, thus taking EtOH effects into account, and (2) the final alcohol concentration in the assay medium remains reasonably low and does not induce excessive drop in luminescence itself (resolving window of the assay - Figure S8C). With these conditions met, any alterations in response to FSK induced by EtOH per se did not interfere with the actual analysis, and we were able to discriminate between ligand-decorated and control NPs and to deduce cAMP inhibitory activity of NP-bound targeting ligands, as will be exemplified below (Figure 6). For testing of higher concentrations of NPs which would result in carry-over of prohibitively high levels of EtOH [above 0.5 - 1% (v/v)] to the assay medium, or when we wanted to focus on cAMP effects of non-targeted NPs or to obtain explicit dose-effect data, we opted for a buffer exchange procedure before the run, thus excluding EtOH as a confounder (Figure 5B,D; Figure 7).
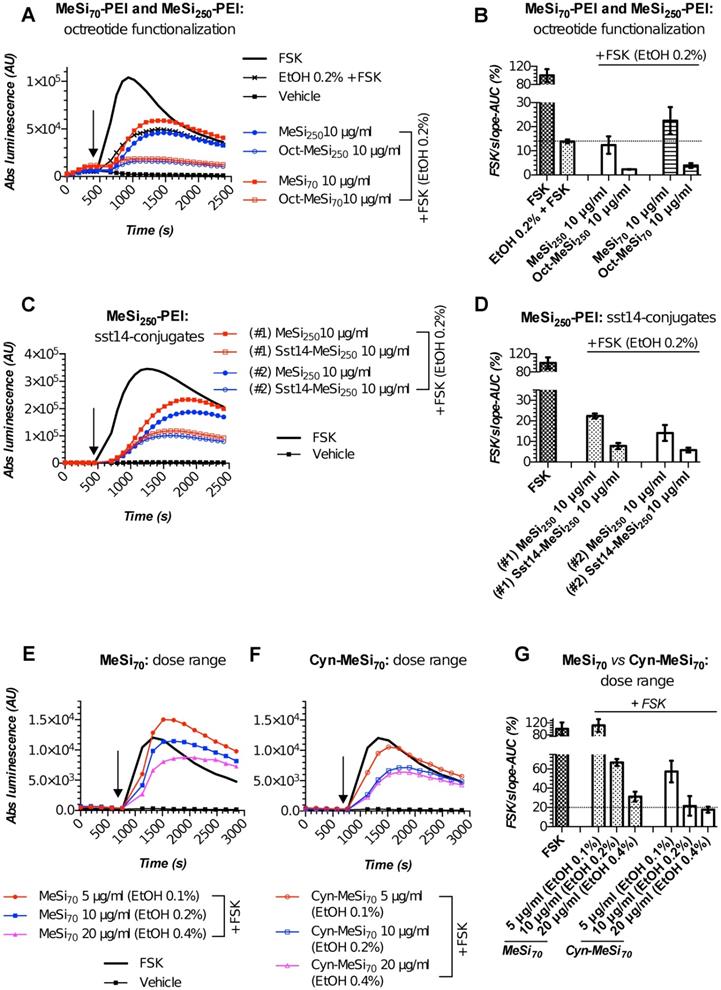
MeSi-based NPs functionalized with octreotide, Sst14 or Cyn-154806: results of targetability screen in Gs22/cAMP with SSTR2-overexpressing cells. (A, C and E-F) Time-course of luminescence signal in Gs22/cAMP assay from representative runs with MeSi250-PEI/MeSi70-PEI NPs functionalized with octreotide, MeSi250-PEI NPs functionalized with Sst14 and MeSi70 NPs decorated with Cyn-154806 respectively. y-axis denotes absolute luminescence values (AU), x-axis denotes time scale (s). (B, D and G) Quantitative comparison of the luminescence curves in cells exposed to octreotide, Sst14- or Cyn-154806-functionalized MeSi NPs by means of FSK/slope-AUC values. The working suspensions of NPs were prepared directly from the master stock in A-EtOH and hence had indicated levels of EtOH admixed (v/v; in parenthesis). See text for details. All the assays were run with HEK-Gs/SSTR2_HA cells at standard conditions. The compounds/NPs were added to the cells simultaneously with FSK; the moment of spiking is indicated by the black arrow. The samples were processed in three (3x) technical replicates; error bars represent mean +/- SD (omitted for visual clarity for luminescence curves on panels A, C and E-F).
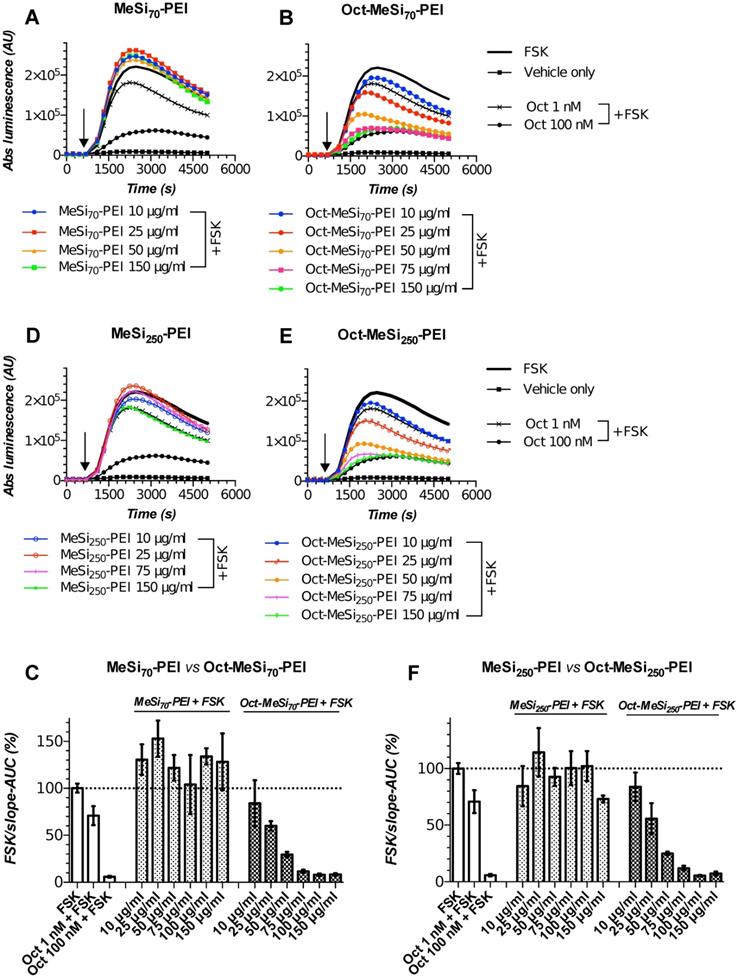
MeSi-based nanoformulations retain peptide shell and targetability with prolonged storage. (A-B/D-E) Luminescence curves for selected concentrations of MeSi70-PEI vs Oct-MeSi70-PEI and MeSi250-PEI vs Oct-MeSi250-PEI, respectively; y-axis represents absolute luminescence values (AU) and x-axis denotes time scale (s). (C/F) FSK/slope - AUC values (%) for the luminescent curves of different concentrations of MeSi70-PEI and MeSi250-PEI, respectively. MeSi70-PEI and MeSi250-PEI were re-tested in Gs22/cAMP assay with HEK-Gs/SSTR2HA cells after being kept in A-EtOH at +4°C for about 15 months. NPs underwent several rounds of buffer exchange immediately before testing, with the final preparations suspended in HEPES (25 mM, pH 7.4), thus ensuring no carry-over of EtOH or possibly liberated octreotide took place from the stock suspension. Note the differences in signal between control (non-tagged) NPs of both sizes: exposure to MeSi70-PEI produced a sizable rise in light output across the dose range tested; MeSi250-PEI generally remained neutral (luminescence curves come together with the curve of FSK only-treated cells), with only the highest concentration tested (150 μg/ml) evoking an obvious drop in signal. These differences are likely to be attributed to distinct patterns of interaction of MeSi70-PEI and MeSi250-PEI with cell membranes, harboring the bulk of ACs isoforms. Most importantly, octreotide-tagged NPs of both sizes demonstrated clear dose-dependent cAMP inhibition, with the pattern of response mimicking the one of free octreotide. The assay was run at standard conditions. The compounds were added to the cells simultaneously with FSK; the moment of spiking is indicated by the black arrow. All the samples were processed in three (3x) technical replicates; error bars represent mean +/- SD (omitted for the curves on panels A-B and D-E for visual clarity).
Expedited targetability validation of freshly prepared MeSi-based NPs tagged with various SSTR ligands
We next employed HEK-Gs/SSTR2_HA cells for rapid functional screening of NPs devised to target SSTRs (Figure 6). In all the cases, the NPs were originally prepared as master stocks suspended in EtOH (5000 μg of NPs per 1 ml) and subjected to the biosensor cells within 24-72 hours after synthesis. The working suspensions of NPs were prepared directly from the master stocks by diluting the required volumes of stock suspension in the assay medium. In the absence of a buffer exchange procedure, this resulted in a carry-over of EtOH to the sensor cells, with EtOH final levels remaining below 0.5% (v/v).
We performed targetability screens of two related NPs, which were decorated with octreotide - MeSi70-PEI and MeSi250-PEI (Figure 6A,B). Evidently, both NPs had a minor effect on FSK-induced luminescence in a non-tagged state per se, with the bulk of the inhibitory activity attributed to the admixed EtOH. Yet, the data still suggests MeSi250-PEI are likely to have some inherent inhibitory activity on the light output from the sensor cells, whilst MeSi70-PEI were exerting the reverse effect, which can be seen from either downward or upward shift of the corresponding luminescence curves in relation to the signal from EtOH 0.2% (v/v) - treated cells (Figure 6A,B). Most importantly, Oct-MeSi70-PEI and Oct-MeSi250-PEI induced a decline in luminescence from the control curve of the matched dose of non-tagged NPs. With all the other factors possibly affecting luminescence fully matched between the samples under comparison, this phenomenon can be only attributed to activation of SSTR2 on the membranes of the sensor cells by octreotide anchored to the surface of NPs, thus validating the targetability of the nanocarriers.
Apart from the synthetic SSTR ligand octreotide, we conjugated NPs with somatostatin-14 (Sst14). As its name implies, Sst14 is a native peptide agonist of 14 amino acids and has a low nanomolar affinity to all the five SSTR subtypes, unlike octreotide, which preferentially binds to SSTR2 and 5 (Figure 4; Table S1). Thus, Sst14 in principle makes a universal targeting ligand for NPs, allowing for high affinity binding across the full spectrum of SSTRs.
Figures 6C,D demonstrate the performance of two distinct batches of Sst14-conjugated NPs in Gs22/cAMP assay with SSTR2-overexpresing cells. Both these nanosystems are based on the same base NP, MeSi250-PEI, but were decorated with Sst14 under different conditions: batch#1 underwent peptide conjugation in aqueous phase (MES buffer) and carries 11 μg of bound Sst14 per 1 mg of dry NP weight, whilst batch#2 was Sst14-tagged in organic phase (dimethylformamide) and was found to have about twice as much of the peptide bound (ca 23 μg of Sst14 per 1 mg of dry NP weight; Table 2), which is consistent with our previous findings [54]. Expedited testing of the formulations without prior buffer exchange revealed a clear differential response to matched doses of control and Sst14-functionalized particles, with the peptide-tagged NPs inducing a more pronounced decline in signal amplitude. This is in line with the inhibitory activity of Sst14 on cAMP generation and signifies the targeting competence of both of the batches of Sst14-MeSi250-PEI NPs.
Finally, we studied the functional performance of MeSi70-based nanocarrier decorated with the SSTR2-selective peptide antagonist, Cyn-154806. Unlike the full agonists octreotide and Sst14, exhibiting both strong receptor binding and profound inhibition of cAMP by virtue of SSTR activation, Cyn-154806 has been originally characterized as a preferential ligand of SSTR2 which cannot activate the receptor (at least, in terms of cAMP signaling) despite binding to it with low-nanomolar affinity (Table 2) [49,55,56].
Quite surprisingly, we repeatedly observed a sizable cAMP inhibition with Cyn-154806 in SSTR2-overexpressing cells in Gs22/cAMP assay. As can be seen from Figure S9, Cyn-154806 triggered dose-dependent decline of FSK-induced luminescence, though the overall effect was much less potent as compared to octreotide. Our findings are in agreement with the earlier results of Nunn et al, who provided evidence of moderate agonistic activity of Cyn-154806 in SSTR2-overexpressing CHO cells, and with the works of Djordjijevic et al, who observed a synergy between Cyn-154806 and Sst14 in terms of inhibition of FSK-induced growth hormone secretion from primary cultures of rat anterior pituitary cells with up-regulated SSTR2 after exposure to estradiol [57,58]. Together, these results better delineate Cyn-154806 as a partial agonist of SSTR2 rather than a full antagonist. In line with the above, dose-matched studies of bare MeSi70 vs Cyn-MeSi70 revealed additional inhibitory activity of peptide-decorated NPs on FSK-induced luminescence, which reflects the interaction of Cyn-154806 with SSTR2 in the sensor cells and validates the targeting competence of Cyn-MeSi70 NPs (Figure 6E-G).
To conclude, in all the cases shown our bioassay procured solid indirect evidence of interaction of targeting ligands on NPs with the targeted receptors in living cells, which eventually validates the targetability of the tested nanocarriers. The assay was successfully implemented in a screening fashion without preceding solvent exchange of the nanosystems, for the effects of admixed alcohol were accounted for by means of assay design, with every dose of ligand-decorated NPs compared against the matching dose of non-functionalized NPs.
MeSi-based NPs retain targetability with prolonged storage: repetitive testing of NPs in Gs22/cAMP assay
From a practical standpoint, a freshly prepared batch of NPs is expected to undergo a battery of biological tests (e.g. internalization, toxicity) within 2-3 weeks after synthesis, provided this batch is subjected to routine physico-chemical characterization and has passed the initial targetability screen with Gs22/cAMP assay. Thus, we had to ensure that a given batch of NPs preserves the targeting peptide in the attached state and retains the ability to interact with the targeted receptors over this time window. To this end, we repeated Gs22/cAMP assay with two batches of NPs that had been stored at +4°C in A-EtOH for several months, a period well exceeding the time window required for regular NP testing.
Importantly, all the batches of NPs were subjected to buffer exchange immediately before testing to clear the formulation of possibly present adulterating free peptide and to ensure that any differences in signaling between targeted and control NPs could be exclusively attributed to the ligands attached to NPs. Working suspensions of NPs prepared directly from the stock suspension subjected to storage evidently might end up contaminated with liberated targeting peptides.
Figure 7 depicts the results of Gs22/cAMP assay of MeSi70-PEI and MeSi250-PEI NPs that were subjected to repetitive testing after being kept for about 15 months at +4°C as concentrated stock suspensions in A-EtOH (5000 μg of dry NPs/ml). Both formulations were functionalized with octreotide in MES and the results of the initial targetability screen performed immediately after synthesis are presented on Figure 6A-C. Quite remarkably, the particles were still able to potently inhibit FSK-stimulated cAMP production in HEK-Gs/SSTR2_HA cells after buffer exchange. The activity of octreotide-tagged NPs closely followed the typical response pattern of free octreotide (Figure 3A,C), with both Oct-MeSi70-PEI and Oct-MeSi250-PEI producing submaximal inhibition of luminescence at about 75 μg/ml final concentration. Assuming the estimated original octreotide load of the formulations, 75 μg of NPs per 1 ml of medium corresponds to ca 135 nM and 150 nM of free octreotide for Oct-NP70-PEI and Oct-NP250-PEI respectively (counting as if all the NP-bound ligands were liberated into solution; Table 2). These values are in a very good agreement with the experimental data, as the luminescence signal from cells treated with 75 μg/ml of Oct-MeSi70-PEI and Oct-MeSi250-PEI comes very close to the signal from the cells exposed to 100 nM of free octreotide.
Collectively, these results indicate that MeSi-based NPs maintain a high load of targeting peptides and remain signaling-competent even after being stored for more than a year at standard conditions. This data eventually provides clearance for repeated testing of working suspensions of NPs prepared from the same starting stock across the specified time window.
Discussion
The present work pursuits two major aims - to highlight complexities with characterization of targeted nanosystems and to suggest a structured approach that could be used for targetability validation in vitro.
The major requirements to validation of targetability of NPs are intuitive and can be united in a single tripartite scheme: (1) to demonstrate the presence and the correct orientation of targeting ligands on the surface of NPs, (2) to ensure the system exposed to NPs have sufficient amounts of targeted receptors for the effects of ligand-receptor interaction to be significant/measurable and (3) to prove the interaction between NP-bound targeting ligands and targeted receptors does take place in the testing system. Importantly, the tripartite validation scheme is designed to address the general question of functional competence of a given nanoformulation and as such can be employed to virtually any nanoparticulate system devised for targeting of membranous receptors. In line with this, design particularities of a system, i.e. manifold of factors known to affect interaction of NPs with cells, including physical dimensions, shape and surface charge of a nanoformulation, spatial distribution and density of targeting ligands, as well as the length of an anchoring linker for a ligand [8,59-65], do not put any restrictions on the scheme's universal applicability. In other words, the tripartite scheme primarily seeks for «yes/no» type of answer regarding targetability and does not immediately question how efficient ligand-receptor coupling is and what the factors affecting this interaction (targetability) are. Of note, the tripartite scheme follows exactly the same logic, as the staple procedures utilized in pharmacology for ligand - receptor interaction studies. Indeed, surface plasmon resonance, isothermal titration calorimetry and microscale thermophoresis - all measure ligand-receptor coupling (component 3 of the scheme) in the presence of well-characterized and carefully dosed ligand (component 1) and purified or semi-purified receptors available for binding in abundance (component 2) [66-68].
Surprisingly, the large majority of the projects with targeted nanosystems fails to comply with this scheme - and it's only the first component of the criteria's trio (in essence, chemical characterization of NPs) that typically gets properly addressed, thus raising concerns about the veracity of the results and the whole targetability concept (Table 1).
And though we closely examined just one group of receptors (SSTRs) amongst hundreds of possible other targets, there are good grounds to suspect that the status with NPs targeting other receptor classes resembles the case of NPs targeting SSTRs.
The single most important proof of targetability, i.e. validation of coupling of NP-anchored ligands with targeted receptors, tends to be substituted with surrogate endpoints, reflecting the late events of NP-cell interaction beyond the level of targeted receptors, such as uptake of NPs by targeted cells, or uptake- and cargo release-related effects on cell cycle or viability. As was pointed out earlier, these types of events do not necessarily signify ligand-receptor coupling and hence should not be used for targetability validation on their own - rather they become proper subjects of investigation only after the targetability has been validated by an appropriate technique gauging ligand-receptor interaction. For the latter, a functional competence test in a relevant model that mimics the ultimate biological system the NPs are intended to be used in perhaps makes the best option. Examples of such models are purified and immobilized receptors, living cells with verified expression of target receptors or membrane preparations of these cells.
For the functional test itself, virtually any technique that provides unequivocal evidence of ligand-receptor coupling could be used, provided it is sensitive enough and produces quantitate (or semi-quantitative) readout, indicating the ligand-receptor interaction is happening in the expected affinity range. The choice of possibly applicable techniques is manifold, all the way from competition (displacement) tests on membrane preparations with radioactive or fluorophore-tagged free ligands versus ligand-decorated NPs to proximity-dependent techniques like Förster or bioluminescence resonance energy transfer (FRET/BRET) in living cells.
Yet, in case of NPs targeting membranous receptors with known function, another option is to focus on orthogonal signal relay machinery triggered by receptor activation. Depending on the particular receptor type, this can be achieved, for instance, with assays for intracellular second messengers, like cAMP or calcium, or techniques probing recruitment of scaffold proteins, like beta-arrestins or alterations in kinase/ phosphorylase activity.
By showing that ligand-decorated NPs can specifically bind target membrane receptors and the force of the ligand-receptor interaction is within the expected range (typically, nanomolar), or by demonstrating dose-dependent signaling outcomes of ligand-receptor interaction in acceptor cells, one obtains sound evidence of the targeting competence of the nanosystem used. With such evidence at hand, a researcher can feel reasonably sure that the NPs synthesized are not only durable enough to keep targeting ligands attached within a defined time frame, but have them anchored in the right orientation and sufficiently exposed, allowing for the interaction with the targeted receptors. Moreover, in cases where targeting ligand orientation is critical for effective receptor coupling, but verification of directionality of ligand's anchoring to the surface of NPs is technically challenging, a functional competence test might be of immediate aid, highlighting only the nanoformulations with the proper placement of ligands as able to engage the targeted receptors. In the same vein, a functional competent test could be utilized in cases when possible effects of steric hindrance are in question, facilitating selection of a particular surface decoration, allowing for maximal receptor engagement along with minimal steric bulk.
The second component of the targetability validation scheme, the abundance of target receptors in a testing system, is often neglected as well. Still, our results with SSTR profiling of HEK293 and BON1 cells highlight the necessity of thorough characterization of the cell models used, for SSTR repertoires in the above cells lines in our laboratory were at odds with the earlier published profiles. Admittedly, it makes not much sense trying to study a targeted nanocarrier in a system, which does not have the measurable levels of targeted receptor or lacks it whatsoever. Furthermore, by selecting a system with low receptor levels, a researcher is at risk of ending up with false-negative results, i.e. inability to demonstrate targetability due to low abundance of receptors and related minor amplitude of response to targeting ligands.
Overall, failure to address any of the described issues in the characterization pipeline of targeted NPs poses a major risk for the project employing NPs and, strictly speaking, calls against further use of such under-characterized formulations in actual studies of targeted delivery in biological systems. Indeed, if one cannot provide evidence of interaction between targeting ligands on NPs and cognate receptors, the observations from studies of such NPs in vitro or in vivo (internalization, intracellular trafficking, drug release upon cellular entry) cannot be ascribed to active targeting concept. Of further concern, the conclusions on targetability effects from studies of such under-characterized NPs, whether negative or positive, obscure the perspective on targetability and stall further progress.
Herewith, we provide one example of a structured approach to characterization of targeted nanosystems, using MeSi-based NPs decorated with peptide ligands of SSTRs as a model. In full compliance with the described tripartite targetability validation scheme, we ensure that (1) our NPs are properly decorated with targeted ligands, (2) our live cell - based testing system has ample load of targeted receptors and, foremost, (3) we provide unequivocal evidence of interaction between targeted receptors in acceptor cells and targeting ligands anchored to the surface of NPs.
For the latter purpose, we use a biosensor that probes intracellular cAMP stores, as a sensitive method for real-time studies of targeting ligand- targeted receptor interaction in living cells exposed to targeted NPs. After thorough optimization and validation of the assay with targeting ligands in a free state, we identify cells with endogenous yet low expression levels of SSTRs as suboptimal models for targeted NPs testing due to low amplitude of cAMP response. Purposely, we assemble plasmid vectors for human SSTR2, 3 and 5 and generate cell lines with stable co-expression of the selected receptors and cAMP probe. The procured cultures eventually demonstrate superior performance as cAMP sensors, robustly capturing response to a wide range of concentrations of SSTR ligands (hundreds of pM - low μM).
Finally, we fruitfully employ our biosensor cells for characterization and validation of targetability of several distinct MeSi-based nanocarriers functionalized with selected SSTR agonists, revealing dose-dependency of cAMP response to targeting ligands on NPs and separating the genuine cAMP inhibitory activity of targeting ligands from the nanoparticle-dependent effects on cAMP. The resulting live cell-based system produced reliable semi-quantitate data on targeting ligand - targeted receptor interaction even in the presence of response-modifying factors, such as ethanol in our case.
To summarize, we delineate cAMP bioassay as a powerful technique for functional studies of SSTR-targeted NPs, which could be reliably used as a stand-alone tool for targetability validation. Moreover, assuming the universal nature of the assay's analyte, with cAMP acting as a second messenger downstream of dozens of receptors [69], this method could be easily repurposed for studies of nanoparticles decorated with ligands to other classes of GPCRs.
We express hope that before long a similar functional competence test would be deemed necessary for every research project involving targeted nanosystems, providing clearance for a given nanocarrier to enter the ultimate studies of targeted drug delivery or tissue-specific accumulation, with the primary intention of answering the core question - whether decoration of NPs with ligands translates into any benefit in the above aspects.
Materials and Methods
Compounds and reagents
All the chemical compounds and reagents used in the study were dissolved in ultrapure water (Milli-Q; resistivity >18mΩ*cm), if not specified otherwise. 1,3,5-trimethyl-benzene (TMB, 99%) was purchased from ACROS. Decane (99%) was purchased from Alfa Aesar. Cetylmethylammonium bromide (CTAB, AR), cetylmethylammonium chloride (CTAC, AR), anhydrous toluene (AR), ethylene glycol (AR), tetraethyl orthosilicate (TEOS, AR), tetramethyl orthosilicate (TMOS, AR), 3-aminopropyltriethoxysilane (APTES, AR), 3-aminopropyltrimethoxysilane (APTMS, AR), α,ω-bis-NHS-PEG, EDC (N-(3-Dimethylaminopropyl)-N-ethylcarbodiimide) and NH4OH (30 wt.%, AR) were purchased from Sigma. Absolute ethanol (>99.7%) was obtained from ALTIA (Finland, Etax Aa). Aziridine was from Menadiona, S.L. (Spain). Somatostatin-14 (Cat#H-1490) and octreotide acetate (Cat#H-5972) were obtained from Bachem (Switzerland), CYN-154806 (Cat#1843) was from Tocris (UK); the peptides were kept as 100 μM aliquots at -80°C. FSK (LC laboratories, USA; Cat#F-9929) was kept as aliquoted stocks of 10 mM in dimethyl sulfoxide at -20°C. Isoproterenol was from Sigma (Cat#1351005).
Synthesis, functionalization and physicochemical characterization of NPs
The large MeSi NPs (250-300 nm) were synthesized according to our previously published protocols [70], with methanol used as co-solvent. Briefly, 1.19 g of tetramethoxysilane (TMOS) was mixed with aminopropyl trimethoxysilane (APTMS) and FITC to create inherently fluorescent particles, and added to an alkaline solution containing the structure-directing agent cetyltrimethyl ammonium chloride (CTAC). The resulting synthesis mixture had a molar ratio of 0.9 TMOS: 0.1 APTMS: 1.27 CTAC: 0.26 NaOH: 1439 MeOH: 2560 H2O. The suspension was stirred overnight at room temperature (RT). Then the particles were separated by centrifugation, washed with deionized water and dried under vacuum for 24h. The structure-directing agent was then removed by ultrasonication in acidic (HCl) ethanol three times.
The small MeSi NPs (50-70 nm) were produced as described earlier [71]. Briefly, 150 ml of water, 30 ml of ethylene glycol, and 450 mg of cetyltrimethylammonium bromide (CTAB) were heated to +70°C. Then, 2.1 ml of decane was added to expand the pores. After 30 min, 510 μl of 1,3,5-trimethylbenzene (TMB) was additionally added to enlarge the pores. The mixture was stirred at +70°C for 1.5 hours, followed by the addition of the catalyst ammonia (2.5 ml). As silica sources, 1.5 ml TEOS was added dropwise, followed by 0.3 ml APTES and 60 μl of pre-reacted APTES-FITC to obtain fluorescent particles. The molar ratio in the synthesis was 1 TEOS: 0.19 APTES: 0.18 CTAB: 0.55 TMB: 1.6 decane: 5.9 NH3: 88.5 ethylene glycol: 1249 H2O. The reaction was stirred for another 3 hours and left to age overnight without stirring at +70°C. The particles were collected and washed twice with ethanol. Then, the structure-directing agent CTAB was removed as described [71]. To further stabilize the particles, the surface was functionalized with poly(ethylenimine) (PEI). This was achieved by dispersing 200 mg of particles in 20 ml toluene with heating to +70°C under vigorous stirring. Subsequently, 10.4 μl of acetic acid was added, followed by the addition of 104 μl of aziridine. The suspension was stirred overnight, then centrifuged and washed with ethanol.
Octreotide and Cyn-154806 were coupled to NPs via a bis-NHS-PEG linker as follows. First, the particles were suspended in HEPES buffer (10mM, pH 7). Thereafter, 420 μg of bis-NHS-PEG (yielding a 5 molar excess of a targeting peptide) was added to the suspension and stirred for 30 min at RT. The particles were collected by centrifugation to remove the non-reacted linker. Then, the particles were suspended in MES buffer (10 mM, pH 5) and 100 μg of a targeting peptide was added. The reaction was kept in the dark overnight at +4°C. The particles were centrifuged, and the absorbance at 280 nm of the supernatant was measured to estimate the amount of coupled octreotide/Cyn-154806. The particles were washed and redispersed in A-EtOH and stored at +4°C protected from light until further use.
For the conjugation of Sst14, NH2-PEG-COOH (2100 Mol.wt) was used as a linker. First, the linker (33 µL of 10 mg/ ml in DMSO) was activated by using EDC (10 μL) for 30 min at RT. Next, particles were suspended in MES buffer (10 mM, pH 5) and added to the linker solution. The reaction was continued for 2 hours. Then, the particles were washed once and collected by centrifugation to remove the non-reacted linker. Thereafter, 100 μg of Sst14 was added. The reaction was kept in the dark for 12 hours at +4° C. For the organic environment dimethylformamide (DMF) was used instead of MES buffer. Sst14 coupling to NPs was measured as described above. As a final step, the particles were washed and redispersed in A-EtOH and stored at +4°C protected from light.
The size of resulting MeSi NPs has been characterized by transmission electron microscopy (TEM; JEM 1400-Plus, JEOL Ltd., Tokyo, Japan, operating at 80 kV with a tungsten filament and an 11-Mpx CCD camera) and dynamic light scattering (DLS; Malvern ZetaSizer Nano ZS). Furthermore, the electrophoretic mobility (i.e., “net surface charge”) was determined (Malvern ZetaSizer Nano ZS) in order to assess modification of NP surface and NP stability in suspension.
Handling of NPs for biological tests
Working suspensions of NPs were freshly prepared immediately before the assay, following a uniform procedure.
For NPs suspended in A-EtOH, the stock formulations were retrieved from +4°C and, after vigorous vortexing, were sonicated on a waterbath (bath sonicator FinnSonic m03; FinnSonic Oy, Finland) for 3 rounds of 3-5 min each, with additional vortexing in between. The sonication was done at RT, with timely addition of the regular ice to water to prevent it from excessive warming. At the end of the sonication, the required volume of NP stock suspension was transferred to a freshly prepared aqueous solution (either CO2-Independent medium or 25 mM HEPES, pH 7.4) with or without 10x concentration of FSK, to yield the working suspension of NP (10x of the final concentration). The resulting working suspension underwent 2 extra rounds of sonication on the waterbath (5-7 min each), as described and was added to the cells within 30 min of preparation, with one brief round of vortexing immediately before treatment.
For buffer exchange, working suspensions of NPs were prepared as described and subjected to centrifugation on a table-top centrifuge, with the duration of spin and RCF selected depending on the size of NPs (e.g., NPs of 250-300 and 60-70 nm in diameter were spun at 7,000 - 8,000 g for 10 min and at 11,000 - 12,500 g for 10-15 min respectively). After the spin, the supernatant was carefully removed and the pelleted fraction (NPs) was resuspended in 1.5-2 ml of the desired buffer by vigorous vortexing. The procedure was repeated 2-3 extra times, yielding an approximate dilution factor for any non-particulate matter in order of at least x 420 000 (assuming 3x rounds of buffer exchange with a final volume of 1500 μl and with 20 μl of the supernatant remaining in the tube after each round). The adequacy of resuspension of the pelleted NPs was checked with DLS and the resulting suspension was added to the cells within 30 min of preparation.
Cell lines
Human embryonic kidney cell line (HEK293) was obtained from American Type Culture Collection (ATCC, #CRL-1573). Human pancreatic endocrine carcinoma cell line BON1 was a kind gift from Prof. Marta Korbonits (Queen Mary University of London, United Kingdom). Human prostate cancer cell line PC3, human breast cancer cell lines MCF7 and MD-MB-231 were generously provided by Prof. Urban Lendahl (Karolinska Institutet, Stockholm, Sweden). Human glioblastoma cell line was obtained from Prof. Jukka Westermark (University of Turku, Finland). QGP1 human pancreatic endocrine cancer cell line was obtained from JCRB Cell Bank (Osaka, Japan; #JCRB0183; [72]). HEK293 cells were cultured in Dulbecco's Modified Eagle Medium/Nutrient Mixture F-12 (DMEM/F-12; Gibco, Cat#11320033); BON1 cells were propagated in 50/50 (v/v) mixture of DMEM (Sigma, Cat#D6171) and F12K (Kaighn's; Gibco, Cat# 21127022). MCF7, MD-MB-231 and U87-MG cell lines were maintained in DMEM (Sigma, Cat#D6171); QGP-1 and PC3 cell lines were cultured in RPMI-1640 medium (Sigma, Cat#R5886). The media were supplemented with 10% (v/v) of fetal bovine serum (FBS; Biowest, Cat#S1810), 50 U/ml of penicillin and 50 μg/ml streptomycin (both from Gibco, Cat#15140122). The cells were maintained at 37°C in humidified atmosphere with 5% CO2.
Oligonucleotides, plasmid vectors and DNA works
All oligos employed in the study were obtained from either TAG Copenhagen A/S (Denmark) or Integrated DNA Technologies (USA) and came with standard desalting, if not stated otherwise. Explicit information on primers (sequence, product, special comments) can be found in Table S2. Each primer was assigned a unique identification number (PID#number), and these are used throughout the text for unambiguous identification of particular primers employed in certain experiments. Annotated sequences of plasmid vectors for human SSTR2, 3 and 5 are provided in Supplementary Information 2. pGloSensor-22F cAMP plasmid (Cat#E2301) was obtained from Promega.
For gel-purification of PCR products and plasmid preparations intended for cloning or sequencing, visualization of DNA bands in agarose gel was carried out with EtBr under LED light of 470nm (Fastgene Blue LED Illuminator, Cat#FG-05; Nippon Genetics Europe) in order to avoid damage of DNA with UV light. The concentration of nucleic acids was measured with NanoDrop 1000 spectrophotometer (Thermo Fisher Scientific, DE, USA). Sanger sequencing of PCR products and plasmids was performed at either Finnish Microarray and Sequencing Centre, Turku Centre for Biotechnology, Finland or at Macrogen Europe, the Netherlands.
Isolation of human genomic DNA (gDNA)
gDNA was isolated from the buccal epithelial cells of one of the authors (VMP) via the express method proposed by Richards and coworkers [73]. In brief, after having buccal smears obtained, the cotton-covered tips of the presterilized wooden swabs were severed with scissors and transferred to sterile 1.5 ml microcentrifuge tubes (1 cotton tip per tube), containing 600 μl of 50mM NaOH. The samples were vortexed once and placed on a thermoblock for 5 min at +95°C. The lysis procedure was stopped by adding of 60 μl of 1M Tris-HCl, pH 8.0 per tube and successive vigorous vortexing for 10 s. The samples were further centrifuged at 13,000 RCF for 1 min at RT and the supernatant was transferred to fresh 1.5 ml microcentrifuge tubes for either immediate use or storage at -80°C.
Amplification and tagging of coding sequences of human somatostatin receptors 2, 3 and 5
The full coding sequences of SSTR 2,3 and 5 (HUGO Gene Nomenclature Committee symbol/ID (HGNC): SSTR2/11331, SSTR3/11332 and SSTR5/11334) were amplified from the freshly isolated human gDNA (obtained from the first author of the paper as specified above) with the high-fidelity DNA polymerase (KOD Xtreme Hot Start; Merck Millipore, Cat#71975) as follows: 1x Xtreme buffer, 0.4 mM dNTPs, 0.3 μM of forward and reverse primers each (PID#11+12 for SSTR2_HA; #13+14 for SSTR3_Myc; #1+2 for SSTR5_Flag), 0.02 U/μl of DNA polymerase, 2-10 μl of gDNA preparation, ultrapure water to a final volume of 50 μl. The reactions were run on a Biometra T3000 thermal cycler (Biometra, Germany) using the following conditions: #1) +94°C for 2 min; #2) +98°C for 7 s; #3) +57°C for 30 s; #4) +68°C for 90 s, then back to step#2, for 35 cycles overall. After validation of the accuracy of PCR by agarose gel electrophoresis, the amplified coding sequences were either directly isolated from the reaction mixtures or made subject to gel - purification with NucleoSpin columns (Macherey-Nagel, Cat#740609) according to the manufacturer`s instructions.
Generation of a mammalian expression vector for human somatostatin receptor 5
For cloning into pcDNA 3.1/V5-His TOPO-TA mammalian expression vector (Invitrogen, Cat# K480040), the purified SSTR5_Flag coding sequences were 3'-adenylated with 2.5 U of Taq polymerase (Qiagen, Cat#201203) in 50 μl of 1xTaq polymerase reaction buffer with 0.4 mM of dATPs for 10 min at +72°C on a thermocycler. The resulting 3'-adenylated products were immediately ligated into pcDNA 3.1/V5-His TOPO-TA vector according the manufacturer`s instructions and the 1-2 μl of ligation reaction was transformed into 10-beta chemically competent E. coli (New England Biolabs, Cat#C3019). The transformants were seeded on plates containing Luria-Bertani medium with 1.5% (w/v) agar (LB-agar) and 50 μg/ml ampicillin; the plates were left overnight in the incubator at +37°C. Next day, the evolved bacterial colonies were screened by PCR using the in-house established protocol (PID#3+4), as described. The clones demonstrating the right insert on PCR were processed for minipreps with NucleoSpin® Plasmid EasyPure (Macherey-Nagel, Cat#740727) and sent for Sanger sequencing.
In order to obtain the mammalian expression vector for human SSTR5 coupled to mCherry fluorescent protein via P2A linker (SSTR5_Flag-P2A-mCherry; accession #LT962381 at European Nucleotide Archive), SSTR5_Flag sequence was further subcloned into AmCyan-P2A-mCherry plasmid (#45350; AddGene repository), as described below. The coding sequence of SSTR5 was cut out from the earlier generated pcDNA 3.1/V5-His TOPO-TA plasmid by means of double-digest with BsiWI (New England Biolabs, Cat# R0553) and BssHII (Promega, Cat# R6831) and gel-purified. The derived isolate was further directionally cloned with T4 DNA ligase (New England Biolabs, Cat# M0202) into BsmBI-linearized (New England Biolabs, Cat# R0580) and gel-purified AmCyan-P2A-mCherry plasmid. The ligation products were transformed into in-house generated electrocompetent HS996 E. coli [74] and the transformants were seeded on LB-agar (1.5% w/v) plates supplemented with 50 μg/ml of kanamycin. Out of a pool of colonies that survived selection, a fraction underwent the screen with PCR (PID#5+6) and was further checked with Sanger sequencing. Sequencing-validated clones ultimately served as a source for large-scale plasmid preparations (performed with NucleoBond® Xtra Maxi Plus; Macherey-Nagel, Cat# 740416), which were employed in the actual experiments.
Generation of mammalian expression vectors for human somatostatin receptors 2 and 3
SSTR2_HA-P2A-mCherry and SSTR3_Myc-P2A-mCherry expression plasmids (accession #LT962382 and #LT962383, respectively; European Nucleotide Archive) have been assembled via 2-step procedure, involving a common first step and a disparate second step.
For the initial step, PCR-amplified and purified SSTR2_HA and SSTR3_Myc coding sequences were cloned into linearized pMiniT plasmid (New England Biolabs' PCR cloning kit, Cat#E1202S) as suggested by the provider. The ligation products were used for transformation of 10-beta chemically competent E. coli (New England Biolabs, Cat#C3019) and the transformants were plated on LB-agar (1.5% w/v) supplemented with 100 μg/ml of ampicillin. The clones bearing the right insert were identified by colony PCR and validated by Sanger sequencing (PID#7+8). The verified clones were further processed for mid-scale plasmid preparation with GeneJET Plasmid Midiprep Kit (Thermo Scientific, Cat# K0481).
The second step in SSTR2_HA-P2A-mCherry vector generation involved subcloning of SSTR2_HA coding sequence into AmCyan-P2A-mCherry plasmid. For this, SSTR2_HA coding sequence was PCR-amplified from pMiniT vector utilizing high-fidelity KOD Xtreme Hot Start DNA polymerase and primers carrying 5-prime overhangs (PID#9+10) to the ultimate expression plasmid. The PCR products were gel-purified and ligated into BsmBI-linearized (New England Biolabs, Cat# R0580) and gel-purified AmCyan-P2A-mCherry plasmid with Gibson assembly master mix (New England Biolabs, Cat# E2611) [75]. The resulting ligation reaction was purified with YM-100 kDa centrifugal filter unit (Merck Millipore) and transformed into DH10-beta electrocompetent E.coli (New England Biolabs, Cat# C3020) employing Electroporator 2510 (Eppendorf AG, Germany), at 1350 V, 600 Ω and 10 mcF. The transformants were seeded on LB-agar (1.5% w/v) plates supplemented with 15-25 μg/ml kanamycin and kept overnight at +37°C. The evolved bacterial colonies underwent screen with PCR as described (PID#5+6), with a subset of insert-carrying clones further validated by Sanger sequencing.
For the assembly of SSTR3_Myc-P2A-mCherry plasmid, pMiniT-SSTR3_Myc vector was double digested with BsiWI (New England Biolabs, Cat# R0553) and BssHII (Promega, Cat# R6831) and the released SSTR3_Myc coding sequence was gel-purified. Finally, SSTR3_Myc sequence was cloned into BsmBI-linearized (New England Biolabs, Cat# R0580) and gel-purified AmCyan-P2A-mCherry plasmid with T4 ligase (New England Biolabs, Cat# M0202). The ligation reaction was used for transformation of DH10-beta electrocompetent E.coli (New England Biolabs, Cat# C3020), with the ensuing selection and PCR screen of the evolved bacterial colonies carried out as described earlier for SSTR2_HA-P2A-mCherry vector.
Bacterial colonies screening by PCR
Transformed bacteria were seeded on LB-agar (1.5% w/v) plates supplemented with appropriate selection agents and incubated overnight at desired temperature conditions. The screen was initiated next day, once evolved bacterial colonies had reached sufficient size (at least 1-2 mm). A few dozens of colonies were randomly picked with sterile wooden toothpicks, using a fresh toothpick for every single colony. A toothpick with bacteria attached to its tip was initially dipped for 1-2 s into one well of 96 - well PCR plate (4titude UK; Cat#4ti-0740) prefilled with 5 μl of ultrapure water supplemented with 20 μg/ml of RNase A (Sigma, Cat# R5503), then removed and dipped for another few seconds into a corresponding single well of a 96 - well polystyrene round-bottom plate for suspension cultures (Greiner; Cat#650185) prefilled with 150 μl/well of LB medium supplemented with appropriate selection agent. Suchwise, two «replicate» 96-well plates are prepared simultaneously: the first one to be used for actual screening by PCR (screen plate), and the second one serving as a handy living stock of all the clones that underwent PCR (stock plate), allowing for easy and error-free maintenance and expansion of the selected clones once screen PCR results become available.
The stock plate was covered with a lid and placed onto a thermoshaker (Thermomixer Comfort, Eppendorf AG, Germany) for incubation at +37°C and 400 RPM for 8-12 h; after that the plate was transferred to +4°C and kept until further use. The screen plate was further spiked with 10 μl/well of master mix, yielding a final reactions volume of 15 μl/well, containing 0.01U/μl of DNA polymerase (Biotools, B&M Labs, S.A., Cat# 10002-4100), 333 μM of dNTPs, 0.167 μM of forward and reverse primers in 1x standard buffer for the polymerase. The reactions were run on a Biometra T-gradient thermocycler (Biometra, Germany) using the following conditions: #1) +98°C for 2 min; #2) +94°C for 45 s; #3) +55-59°C for 30 s (annealing temperature is primer specific); #4) +72°C for 60 s/1000 bp of amplicons length, then back to step#2, for 35 cycles overall; #5) +72°C for 5 min. The primers for the screening assay were purposely designed to either produce no product in the absence of the correct insert (e.g., with one primer landing in the backbone and the other having a complementary region within the insert) or to produce products of sensibly different size for cases of no insert/insert present. The resulting PCR products were resolved on agarose gel - the presence of the band of the expected size indicated the clones likely to have the correct insert. A small set (typically 4-8) of selected correct clones was further retrieved from the stock plate and expanded in larger volumes of liquid LB with appropriate selection agents, with the ensuing cultures processed for plasmid preparations. The latter were ultimately validated for the correct insert presence and its orientation with Sanger sequencing.
Generation of cAMP sensor cell lines
HEK293 cells, stably expressing GloSensor-22F cAMP probe (HEK-Gs), had been generated in-house and characterized earlier [36]. In order to obtain double-stable cell lines, overexpressing GloSensor-22F cAMP probe and a desired SSTR subtype, HEK-Gs cells were transfected with SSTR2_HA-P2A-mCherry, SSTR3_Myc-P2A-mCherry or SSTR5_Flag-P2A-mCherry plasmids. Transfections were carried out with Xfect polymer (Clontech Laboratories, Cat#631317), according to the manufacturer`s instructions. After 4-6 weeks of continuous selection with 500 μg/ml geneticin (G418; Roche, Cat#04727878001), the evolved stable clones were further sorted at least twice with FACSAria IIu cell sorter (Beckton Dickinson; provided by Cell Imaging Core of Turku Centre for Biotechnology) to collect the brightest fraction of mCherry-positive cells. As mCherry and SSTRs are transcriptionally coupled via P2A linker [46], both proteins are expected to accumulate in proportional amounts in the cells with the plasmid expression, which makes a rationale for the above FC-aided enrichment approach. The expression of target SSTR subtypes in the procured cultures was eventually validated with indirect immunolabelling in flow cytometry analysis, as described below. BON1 cells, stably expressing GloSensor-22F cAMP probe (BON-Gs), were derived and characterized in a similar fashion.
Indirect immunolabelling of SSTR2, 3 and 5 and flow cytometry analysis
The cells to be immulabelled were propagated in 25 or 75 cm2 flasks in appropriate complete medium under standard conditions, as indicated. On the day of analysis, the cells were detached by trypsinization, counted and spun down (500 g, 5 min, RT); after having the supernatant removed the cell pellet was resuspended in appropriate volume of ice-cold stain buffer (SB; 1xPBS with 10% (v/v) FBS and 1% (v/v) Normal Donkey Serum (Jackson ImmunoResearch; Cat#017-000-121)) and the cells were left on ice for 10 min. From this point onwards, the procedure was split into two arms, carried out in parallel, as described below:
Immunolabelling of viable non-fixed and non-permeabilized cells
The resulting cell suspension was transferred to a 96-well plate (round bottom, for suspension cultures; Greiner; Cat#650185), aiming to have 300 000 - 500 000 cells per well. The plate was spun down once (600 g, 4 min, +4°C), the supernatant removed and the cells suspended in 100 μl/well of either ice-cold SB (no-stain controls and secondary Ab-only controls) or SB with appropriate concentration of primary Ab (samples). After incubation on ice for 30 min, the cells were washed twice with ice-cold SB and resuspended in 150 μl/well of either ice-cold SB (no-stain controls) or SB with appropriate concentration of secondary Ab (samples and secondary Ab-only controls). After another round of incubation on ice for 30 min in the dark, the cells were washed three times with ice-cold SB. Next, the cells were resuspended in 150 μl/well of 2% (w/v) PFA in 1xPBS and left for 15 min at RT in the dark. Finally, the plate was spun down (600 g, 4 min, +4°C), PFA solution was removed and the cells were suspended in 150 μl/well of 1xPBS. The plate was kept at +4°C protected from light (wrapped in aluminium foil) till FC analysis.
Immunolabelling of PFA-fixed and saponin-permeabilized cells
After incubation with SB, the cells were spun down (500 g, 5 min, +4°C), cleared of the supernatant and suspended in 2% (w/v) PFA in 1xPBS. After fixation for 15 min at RT, the samples were centrifuged again, PFA was removed and the cells were suspended in 1xPBS, with subsequent transfer to a 96-well plate, as described above.
The plate was spun down once (600 g, 4 min, +4°C), the supernatant removed and the cells were suspended in 200 μl/well of ice-cold permeabilization buffer (PB; SB supplemented with 0.1-0.3% (w/v) saponin (Fluka; Cat#47036)). After incubation for 15 min on ice, the plate was spun down once again and PB was removed. Next, the cells were incubated for 30 min on ice in either ice-cold PB (no-stain controls and secondary Ab-only controls) or PB with appropriate concentration of primary Ab (samples). Three wash rounds with PB followed the incubation step. Further, the cells were incubated for 30 min on ice in either ice-cold PB (no-stain controls) or PB with appropriate concentration of primary Ab (samples and secondary Ab-only controls). Then, the cells were washed three times with PB. Finally, the cells were suspended in 150 μl/well of 0.5% (w/v) of PFA in 1xPBS, and kept at +4°C protected from light (the plate wrapped in aluminium foil) till FC analysis.
Antibodies
Primary Abs recognizing intracellular epitopes that were used on permeabilized cells: anti-SSTR2 (MAB4224; R&D systems; mouse monoclonal Ab (mAb); 1:250), anti-SSTR3 (UMB-5; Abcam; rabbit mAb; 1:800), anti-SSTR5 (UMB-4; Abcam; rabbit mAb; 1:1000).
Primary Abs recognizing exposed plasma membrane-bound epitopes that were used on non-permeabilized cells: anti-HA tag (A190-107; Bethyl; goat polyclonal Ab (pAb); 1:1000), anti-Myc tag (9E10; Developmental Studies Hybridoma Bank; mouse mAb; 3 μg/ml), anti-Flag tag (F7425; Sigma; rabbit pAb; 1:600).
Anti - β-tubulin primary Ab (9F3; Cell Signaling; rabbit mAb; 1:400) was used on both permeabilized and non-permeabilized cells for control of adequacy of plasma membrane permeabilization or absence of thereof respectively.
Secondary Abs (all - Invitrogen; Alexa488-conjugated; raised in donkey; 1:2000): anti-goat (A11055), anti-mouse (A21202), anti-rabbit (A21206).
FC analysis
All the samples were analyzed on LSRII cytometer (Beckton Dickinson; provided by Cell Imaging Core of Turku Centre for Biotechnology). After gating for the target cell population (FSC area vs SSC area) and exclusion of the likely cellular «doublets» (FSC height vs FSC width; SSC height vs SSC width), at least 15 000 events were collected. As all the secondary Abs used were conjugated to Alexa488, the samples were exited with 488 nm laser and the emission was collected on log scale with (505 nm longpass)/(530/30 nm bandpass) filter set. Raw data analysis and chart plotting were carried out with the Flowing Software 2.5.1 (available for downloading at http://flowingsoftware.btk.fi/index.php?page=1)
cAMP assays
Measuring cAMP levels with GloSensor-22F cAMP probe
Cells with stable expression of GloSensor-22F cAMP sensor were seeded one day before the experiment into tissue culture-treated polystyrene 96-well plates with light-tight walls and translucent bottom (ViewPlate-96, PerkinElmer, Cat#6005181) as 30,000 - 60,000 cells per well in the 150 μl of cell type-specific complete medium. After overnight incubation at standard conditions (+37°C in humidified atmosphere with 5% CO2), the plates were removed from the incubator and processed for the actual assay, as follows. For the initial step, the old culture medium was removed and the wells were replenished with 45 μl of the freshly prepared Induction Mix, comprised of 2% v/v of GloSensor reagent (Promega, Cat#E1290) in the cell type - specific Induction Medium (4 volumes of cell - specific medium supplemented with 0.1% (w/v) of bovine serum albumin per 5 volumes of CO2 - independent medium (Gibco; Cat18045-054)); if needed, the Induction Mix could also include 200 μM of a non-specific phosphodiesterase inhibitor 3-Isobutyl-1-methylxanthine (IMBX; Sigma, Cat#I5879). The plates were wrapped in aluminium foil for light protection and left at RT for 60-120 min to equilibrate. Next, the plate was placed into a multiwell platereader capable of measuring luminescence (EnSight Multimodal Platereader, PerkinElmer, USA or Victor2 1420-12 platereader, Wallac Oy, Finland) and the light output - denoted as a baseline signal - was captured in a kinetic fashion (all the target wells on a plate are read once in a desired sequence, after that the read starts again and proceeds identically, with the procedure being repeated the required number of times) for at least 10-20 min at RT. After that, the plate was retrieved from the machine and the wells were spiked with 5 μl of freshly prepared 10x solutions of reagents (either in CO2-Independent medium or 25 mM HEPES, pH 7.4), providing 1:10 dilution to a final desired 1x working concentration. After having the reagents added, the plate was immediately re-inserted into the reader and the luminescence signal (now denoted as induced signal) was captured further using the identical conditions for the time required (typically, for 30-60 min).
For the assays performed in a 24-well plate format, the cells were seeded as 125,000 - 250,000/well one day before the run and the volumes of all the reagents were scaled up accordingly; all the other conditions were kept identical otherwise. All the assays with NPs were carried out in the identical fashion, with freshly prepared suspensions of NPs added to the cells simultaneously with FSK.
Processing of raw data gained in Gs22/cAMP assay
The «raw» luminescence signal captured from the cells in Gs22/cAMP assay typically follows a uniform pattern of an asymmetric dome-shaped curve which is foreran by a straight line and has a declining arm of various steepness on the right (Figure S10A,C; upper panels).
This pattern reflects the actual cAMP oscillations in the cells under study: the linear signal of low-intensity in the beginning of the read denotes baseline levels of cAMP in the equilibrated cells; subsequent addition of the agent inducing cAMP production (e.g., FSK) triggers a rapid rise in luminescence, reaching its peak within few minutes (typically, 5-15 min) after stimulation; further on comes the phase of steady signal decline lasting for tens of minutes and reflecting the gradual depletion of the accumulated intracellular cAMP pool.
Though in virtually all of the cases one can easily deduce the effects of treatments by simple visual inspection of the raw luminescence curves (as nicely exemplified by Figure 3A-B, demonstrating cAMP-inhibiting efficacy of different concentrations of free octreotide), this approach evidently does not allow for precise integration and comparison of results gained across several runs.
Sizable inter-run variation of absolute luminescence values represents another factor hindering quantitate analysis. This is mainly due to the fact that the assay is based on the luminescence emanating from the living cells. Thus, the cells remain sensitive to a multitude of environmental factors (i.e., ambient temperature, equilibration time, cell plating density and passage number), which despite the best efforts taken are virtually impossible to maintain fully stable. The resulting (and almost inevitable) inter-run variation in terms of absolute light output is a direct consequence of the above.
In order to address the described limitations, we considered several strategies for processing of raw luminescence data gained in Gs22/cAMP assay - each yielding a normalized «integral index» for a given luminescence curve.
The initial evident approach was to employ baseline signal-subtracted maximum induced luminesce for such an index, which primarily reflects the peak light output after stimulation. By taking the highest signal from FSK only - treated cells in every given run for 100%, all the samples could be normalized to this value, yielding FSK-normalized Max Luminescence (FSK- Lmax):

where Lmax and  base stand for induced maximum luminescence and average baseline luminescence respectively. As every assay incorporated a set of technical replicates, in practice the normalization was done to the average value of baseline signal-subtracted peak luminescence from all FSK - only replicates.
Using a visual inspection of raw luminescence curves as a reference standard, it becomes clear that FSK-Lmax allows for discrimination between evidently distinct entities, as exemplified by assay with different concentrations of free octreotide in HEK_Gs/SSTR5 cells (Figure S10A,D). In fact, FSK- Lmax does a good job in the majority of cases, especially provided the curves under scrutiny have about uniform shape.
However, in certain scenarios some of the samples can demonstrate the light output dynamics, which significantly differs from the luminescence pattern of the remaining samples under comparison. For instance, high-dose octreotide treatment (5 μM) in HEK-Gs/SSTR2 cells exhibited a distinct luminescence pattern, principally defined by prolonged and low-sloped rise in signal after stimulation, that contrasted uniform light output dynamics from the cells received low concentrations of octreotide or FSK only (Figure S10B, upper panel).
Another pertinent example can be found on Figure S10C (upper panel), where treatment of HEK-Gs/SSTR2 cells with 0.2% (v/v) EtOH was characterized by somewhat delayed increment in signal after FSK stimulation, though the light output eventually reached about the same peak value as was observed with 0.02% (v/v) EtOH. As a consequence, the resulting luminescence curves of EtOH 0.02% and 0.2% have roughly the same shape and amplitude, but are shifted along the time axis.
A human eye cannot be tricked by these cases, and just a brief visual examination of the raw luminescence curves will identify the high dose octreotide and 0.2% EtOH - treated cells as distinct entities. Nevertheless, FSK- Lmax index fails to discriminate the above two cases from the samples producing comparable peak light output (octreotide 50 nM vs 5 μM, Figure S10B; EtOH 0.02% vs 0.2%, Figure S10C), as it is principally based on the peak light output and does not account for signal dynamics over time.
In an attempt to retain more information from the raw luminescence values, we tried to reserve to a different index, FSK-normalized Area Under the Curve (FSK-AUC):
(AUC(sample) / AUC(fsk)) × 100 (%)
Area Under the Curve (AUC) for a luminescence signal was estimated with either in-built operator of GraphPad Prism package (Total Peak Area with subtraction of the baseline signal), or with a custom-written data processing script (available from the authors upon request), both employing trapezoidal method [76] and producing similar results.
As AUC provides an integral assessment of a signal over time period, it should confer better idea of the original luminescent curve as opposed by just peak luminescence, which is a point estimate only. Despite the expectations, FSK-AUC showed about the same performance as FSK-normalized Max Luminescence - whilst being able to discriminate the curves of similar shape but different amplitude (Figure S10A,D), the index failed to separate the already described cases with dissimilar pattern of light output (Figure S10B,C).
As a next step, we tried to employ the third index - FSK-normalized and time-corrected Area Under the Curve (FSK/t-AUC), which takes into account the time it takes the signal to reach its maximum after stimulation (tmax):
(AUC(sample) / tmax (sample)) / (AUC(fsk) / tmax (fsk) ) × 100 (%)
As such, the index of FSK/t-AUC makes an «improved» version of FSK-AUC, which should retain more information on the time domain of the signal and hence is expected to serve as a better discriminator of luminescence curves as opposed to FSK-AUC.
And indeed, FSK/t-AUC provides much better resolution, describing the treatments with 50 nM and 5 μM of octreotide (Figure S10B) and 0.02% and 0.2% of EtOH (Figure S10C) as separate entities, which was already obvious from visual inspection of the raw luminescence curves.
However, despite the obviously improved performance, FSK/t-AUC may still produce misleading data, specifically when the curves under comparison have their Max luminescence/AUC and time to peak signal changing in the same direction. This is exemplified by Figure S10D, where exposure to 100 pM of octreotide in HEK_Gs/SSTR5 cells yields higher peak luminescence (and higher AUC) than exposure to FSK only. However, as the time to maximum signal in octreotide - treated cells is longer than in FSK only-treated cells, the resulting indices for both samples become virtually identical. A similar erroneous «fusion» might happen when a curve of higher amplitude is compared to a curve of lower amplitude but with much shorter time to peak luminescence.
A logical way to circumvent this limitation of FSK/t-AUC index is to substitute kinetics of the signal (increment in luminescence per unit of time) for time to a peak signal as a correction factor for AUC. To ease the required calculus, we can ignore the non-linearity in signal dynamics, by assuming that after stimulation the light output builds up at a fixed pace till it reaches its maximum. With this we would arrive with a right triangle for a left half of a given luminescent curve, that has time to a peak signal (x-axis) and maximum signal (y-axis) for its legs. The quotient of a maximum signal to time here will reflect the average kinetics of luminescence and is numerically equal to tan (θ) (an angle between hypotenuse and x-axis) or the slope of hypotenuse.
This brings us to the final index - FSK-normalized and slope-corrected Area Under the Curve (FSK/slope-AUC):
((AUC(sample) × Lmax (sample) / tmax (sample)) / (AUC(fsk) × Lmax (fsk) / tmax (fsk))) × 100 (%)
In other words, FSK/slope-AUC reflects a definite integral of luminescence corrected for the velocity of signal rise. With this, FSK/slope-AUC should be able to discriminate luminescent curves primarily on the base of their AUC (signal amplitude), but with taking the steepness of the rising arm of the curve into account, allowing for efficient resolution of samples with varying signal kinetics but otherwise similar maximum signal amplitude/AUC. In fact, FSK/slope-AUC was able to describe all the highlighted «troublesome» curves as separate entities, avoiding the limitations inherent to the other indices considered herewith (Figure S10A-D).
Nevertheless, one has to remember that FSK/slope-AUC index provides a simplified reflection of a luminescence curve and by no means could encompass the original signal kinetics in its entirety. Hence, FSK/slope-AUC might still fail to discriminate between certain types of signal curves, which would appear as separate entities to a human eye. One germane (yet theoretical) example of such failure is a pair of curves of identical amplitude but with differentially stable absolute signal kinetics (the pace of signal build-up equals the pace of signal decay for each curve, but absolute pace of signal change is different between the curves). However, we have not observed similar signal patterns in Gs22/cAMP assay and this issue seems to be of mostly theoretical concern. For the actually observed signal patterns, FSK/slope-AUC universally allowed for efficient sample discrimination, complying with the visual inspection of the curves.
Based on this rationale, and subsequent validation with several alternative data sets from Gs22/cAMP assay against a visual assessment of curves as a benchmark, FSK/slope-AUC was selected as a standard index for processing of luminescence data and was routinely employed for curve fitting (dose-response) and inferential statistics in the present paper.
Measuring cAMP levels with AlphaScreen technology
AlphaScreen cAMP Detection Kit (PerkinElmer, Cat#6760635D) was used as suggested by the manufacturer, with minor modifications. In brief, the cells to be probed for cAMP levels were plated in a suitable vessel (25 - or 75 - cm2 flask) and propagated in appropriate complete medium for 1-2 days before the actual assay. On the day of analysis, the cells were detached by trypsinization and counted, after that the required number of the cells was suspended in Stimulation Buffer (a cell type - specific Induction Medium as described for Gs22/cAMP assay with 200 μM of IBMX) of RT, yielding a suspension of 4,000 cells/μl. After incubation for 15-20 min at RT, the suspension was mixed with equal volume (1:1) of 10x Acceptor Beads solution in Stimulation Buffer and the resulting suspension was transferred to a 384 - well polystyrene plate (AlphaPlate-384; PerkinElmer, Cat#6005350) as 5 μl/well, producing a load of 10,000 cells/well. Next, the wells were spiked with 5 μl/well of the Induction Mix, consisting of 20 μM of FSK with or without octreotide (2x final concentration) dissolved in Stimulation Buffer, and the plate was left for 10 min at RT in the dark to allow for cAMP accumulation in the cells. The incubation time was set for 10 min and not for 30 min as suggested by the vendor, for maximum induction of luminescence in Gs22/cAMP assay (and hence cAMP accumulation) in the cells was typically achieved within 10 min after FSK stimulation, with the signal decaying afterwards. At the end of the incubation period, all the wells were spiked with 15 μl of 1.67x mix of biotin-cAMP (41.7 nM) and streptavidin donor beads (33.3 μg/ml) in 1x Immunoassay Buffer, with the Mix being freshly prepared and preincubated for 30 min at RT in the dark before addition to the cells. After that the plate was sealed with an adhesive film to minimize evaporation losses and left for 1h at RT to allow for cell lysis and cAMP liberation. Apart from the actual sample wells with the cells, the assay plate also incorporated a set of wells with cAMP standards covering a range of cAMP concentrations from 0 to 1 μM prepared in the same Stimulation Buffer according to the manufacturer`s instructions. The standards were processed in parallel with the sample wells, all done in three technical replicates. As a final step, the plate was read on AlphaScreen technology - compatible multiwell platereader (EnSight Platereader, PerkinElmer, USA). The signal from cAMP standards served for reconstruction of the standard curve, with the latter being used for deduction of the absolute cAMP values achieved in cells treated with FSK and different concentrations of octreotide.
Data transformation and curve fitting
Data transformations, as well as curve fitting were carried out with GraphPad Prism v6.04 package (GraphPad Software San Diego, CA). Sigmoid dose-response curves fitting and IC50 calculations for SSTR agonists were performed using «log (inhibitor) vs. response - Variable slope» (Y=Bottom + (Top-Bottom)/(1+10^((LogIC50-X)×Hill Slope))) operator of GraphPad Prism software.
Abbreviations
Ab/Abs: antibody/ies; A-EtOH: absolute ethanol; AC/ACs: adenylyl cyclase/s; APTES: 3-aminopropyltriethoxysilane; APTMS: 3-aminopropyltrimethoxysilane; AUC: area under curve; BON-Gs: BON1 cell line with stable overexpression of Gs22/cAMP probe; bp/bps: base pair/s; BRET: bioluminescence resonance energy transfer; cAMP: 3′-5′-cyclic adenosine monophosphate; CTAB: cetylmethylammonium bromide; CTAC: cetylmethylammonium chloride; DLS: dynamic light scattering; DMF: dimethylformamide; EDC: N-(3-Dimethylaminopropyl)-N-ethylcarbodiimide; EtBr: ethidium bromide; FACS: fluorescence-activated cell sorting; FC: flow cytometry; FRET: Förster resonance energy transfer; FSK: forskolin; GPCR/GPCRs: G protein-coupled receptor/s; Gs22/cAMP: GloSensor-22F, luminescent cAMP probe; GTP: guanosine-5'-triphosphate; HA: human influenza hemagglutinin epitope; HEK-Gs: HEK293 cell line with stable overexpression of Gs22/cAMP probe; ICH: immunocytochemistry; LB: Luria-Bertani medium; mAb: monoclonal antibody; MES: 2-(N-morpholino)ethanesulfonic acid; MeSi: mesoporous silica; NP/NPs: nanoparticle/s; pAb: polyclonal antibody; PDE/PDEs: phosphodiesterase/s; PEI: poly(ethylenimine); PFA: paraformaldehyde; qRT-PCR: quantitative (real-time) reverse transcription polymerase chain reaction; RT: room temperature; Sst14: somatostatin-14; SSTR/SSTRs: somatostatin receptor/s; TEM: transmission electron microscopy; TEOS: tetraethyl orthosilicate; TMB: 1,3,5-trimethyl-benzene; TMOS: tetramethyl orthosilicate; WB: Western blotting; WT: wild-type.
Acknowledgements
Alexander V. Travov is gratefully acknowledged for excellent technical assistance (writing a script for processing and analysis of luminescence data), critical outlook and many rounds of insightful discussions. We thank Prof. Marta Korbonits (Queen Mary University of London, UK) for providing us with BON1 cell line.
Funding
Our work was supported by European Community Mobility Programme EMA2 (grant #372117-1-2012-1-FI-ERAMUNDUS- EMA21; to VMP), Turku Doctoral Programme of Molecular Medicine (TuDMM; to VMP), K. Albin Johanssons stiftelse (to VMP), Ida Montinin Säätiö (to VMP), Pentti and Tyyni Ekbom foundation (to VMP), Instrumentariumin tiedesäätiö (to VMP), Cancer Society of Finland (to DD), Finnish Cultural Foundation (to DD), The Swiss National Science Foundation (project #P2BSP3_161928; to HK), Sigrid Juselius Foundation (to VM), Jane and Aatos Erkko foundation (to DD, JR), Academy of Finland (project #284542, 309374; to CS, JR), Turku University Foundation (to ARM).
Author Contributions
CS/ARM/VM conceptualized the overall project. ARM and VMP conceived the biosensor assay, carried out cloning of SSTR genes and biosensor cells generation. VMP performed the bioassays, flow cytometry and biochemical assays. DD/HK performed the design, synthesis and physico-chemical characterization of nanoparticles. CS/ARM/VM/JR supervised the research, experimental planning and data analysis. VMP drafted the manuscript. All the authors critically read, amended and approved the final version of the manuscript.
Supplementary Material
Supplementary information, figures and tables.
Competing Interests
The authors have declared that no competing interest exists.
References
1. Lammers T, Kiessling F, Hennink WE, Storm G. Drug targeting to tumors: Principles, pitfalls and (pre-) clinical progress. J Control Release. 2012;161(2):175-87
2. Sikorski AF, Toporkiewicz M, Meissner J, Matusewicz L, Czogalla A. Toward a magic or imaginary bullet? Ligands for drug targeting to cancer cells: principles, hopes, and challenges. Int J Nanomedicine. 2015:1399
3. Petros RA, DeSimone JM. Strategies in the design of nanoparticles for therapeutic applications. Nat Rev Drug Discov. 2010Aug9;9(8):615-27
4. Matsumura Y, Gotoh M, Muro K, Yamada Y, Shirao K, Shimada Y, Okuwa M, Matsumoto S, Miyata Y, Ohkura H, Chin K, Baba S, Yamao T, Kannami A, Takamatsu Y, Ito K, Takahashi K. Phase I and pharmacokinetic study of MCC-465, a doxorubicin (DXR) encapsulated in PEG immunoliposome, in patients with metastatic stomach cancer. Ann Oncol. 2004;15(3):517-25
5. Kirpotin DB, Drummond DC, Shao Y, Shalaby MR, Hong K, Nielsen UB, Marks JD, Benz CC, Park JW. Antibody targeting of long-circulating lipidic nanoparticles does not increase tumor localization but does increase internalization in animal models. Cancer Res. 2006;66(13):6732-40
6. Hrkach J, Von Hoff D, Mukkaram Ali M, Andrianova E, Auer J, Campbell T, De Witt D, Figa M, Figueiredo M, Horhota A, Low S, McDonnell K, Peeke E, Retnarajan B, Sabnis A, Schnipper E, Song JJ, Song YH, Summa J, Tompsett D, Troiano G, Van Geen Hoven T, Wright J, LoRusso P, Kantoff PW, Bander NH, Sweeney C, Farokhzad OC, Langer R, Zale S. Preclinical development and clinical translation of a PSMA-targeted docetaxel nanoparticle with a differentiated pharmacological profile. Sci Transl Med. 2012Apr4;4(128):128ra39
7. Senzer N, Nemunaitis J, Nemunaitis D, Bedell C, Edelman G, Barve M, Nunan R, Pirollo KF, Rait A, Chang EH. Phase I Study of a Systemically Delivered p53 Nanoparticle in Advanced Solid Tumors. Mol Ther. 2013May;21(5):1096-103
8. Mahon E, Salvati A, Baldelli Bombelli F, Lynch I, Dawson KA. Designing the nanoparticle-biomolecule interface for “targeting and therapeutic delivery”. J Control Release. 2012Jul20;161(2):164-74
9. Albanese A, Tang PS, Chan WCW. The Effect of Nanoparticle Size, Shape, and Surface Chemistry on Biological Systems. Annu Rev Biomed Eng. 2012;14(1):1-16
10. Barbieri F, Bajetto A, Pattarozzi A, Gatti M, Würth R, Thellung S, Corsaro A, Villa V, Nizzari M, Florio T. Peptide Receptor Targeting in Cancer: The Somatostatin Paradigm. Int J Pept. 2013Jan;2013(Table 1):1-20
11. Reubi J, Waser B, Schaer J-C, Laissue J. Somatostatin receptor sst1-sst5 expression in normal and neoplastic human tissues using receptor autoradiography with subtype-selective ligands. Eur J Nucl Med Mol Imaging. 2001Jul1;28(7):836-46
12. Bauer W, Briner U, Doepfner W, Haller R, Huguenin R, Marbach P, Petcher TJ, Pless. SMS 201-995: a very potent and selective octapeptide analogue of somatostatin with prolonged action. Life Sci. 1982Sep13;31(11):1133-40
13. Chalabi M, Duluc C, Caron P, Vezzosi D, Guillermet-Guibert J, Pyronnet S, Bousquet C. Somatostatin analogs: does pharmacology impact antitumor efficacy? Trends Endocrinol Metab. 2014Jan6;25(3):115-27
14. Abou DS, Thorek DLJ, Ramos NN, Pinkse MWH, Wolterbeek HT, Carlin SD, Beattie BJ, Lewis JS. 89Zr-Labeled Paramagnetic Octreotide-Liposomes for PET-MR Imaging of Cancer. Pharm Res. 2013Mar7;30(3):878-88
15. Chang C-C, Liu D-Z, Lin S-Y, Liang H-J, Hou W-C, Huang W-J, Chang C-H, Ho F-M, Liang Y-C. Liposome encapsulation reduces cantharidin toxicity. Food Chem Toxicol. 2008Sep;46(9):3116-21
16. Dai W, Jin W, Zhang J, Wang X, Wang J, Zhang X, Wan Y, Zhang Q. Spatiotemporally controlled co-delivery of anti-vasculature agent and cytotoxic drug by octreotide-modified stealth liposomes. Pharm Res. 2012Oct;29(10):2902-11
17. Iwase Y, Maitani Y. Octreotide-targeted liposomes loaded with CPT-11 enhanced cytotoxicity for the treatment of medullary thyroid carcinoma. Mol Pharm. 2011Apr4;8(2):330-7
18. Petersen AL, Binderup T, Jølck RI, Rasmussen P, Henriksen JR, Pfeifer AK, Kjær A, Andresen TL. Positron emission tomography evaluation of somatostatin receptor targeted 64Cu-TATE-liposomes in a human neuroendocrine carcinoma mouse model. J Control Release. 2012Jun10;160(2):254-63
19. Sun M, Wang Y, Shen J, Xiao Y, Su Z, Ping Q. Octreotide-modification enhances the delivery and targeting of doxorubicin-loaded liposomes to somatostatin receptors expressing tumor in vitro and in vivo. Nanotechnology. 2010Nov26;21(47):475101
20. Zhang J, Jin W, Wang X, Wang J, Zhang X, Zhang Q. A novel octreotide modified lipid vesicle improved the anticancer efficacy of doxorubicin in somatostatin receptor 2 positive tumor models. Mol Pharm. 2010;7(4):1159-68
21. Huo M, Zou A, Yao C, Zhang Y, Zhou J, Wang J, Zhu Q, Li J, Zhang Q. Somatostatin receptor-mediated tumor-targeting drug delivery using octreotide-PEG-deoxycholic acid conjugate-modified N-deoxycholic acid-O, N-hydroxyethylation chitosan micelles. Biomaterials. 2012;33(27):6393-407
22. Jaskula-Sztul R, Xu W, Chen G, Harrison A, Dammalapati A, Nair R, Cheng Y, Gong S, Chen H. Thailandepsin A-loaded and octreotide-functionalized unimolecular micelles for targeted neuroendocrine cancer therapy. Biomaterials. 2016Jun21;91(20):1-10
23. Xu W, Burke JF, Pilla S, Chen H, Jaskula-Sztul R, Gong S. Octreotide-functionalized and resveratrol-loaded unimolecular micelles for targeted neuroendocrine cancer therapy. Nanoscale. 2013Oct21;5(20):9924
24. Zhang Y, Wang X, Wang J, Zhang X, Zhang Q. Octreotide-modified polymeric micelles as potential carriers for targeted docetaxel delivery to somatostatin receptor overexpressing tumor cells. Pharm Res. 2011;28(5):1167-78
25. Zou A, Huo M, Zhang Y, Zhou J, Yin X, Yao C, Zhu Q, Zhang M, Ren J, Zhang Q. Octreotide-Modified N-Octyl-O, N-Carboxymethyl Chitosan Micelles as Potential Carriers for Targeted Antitumor Drug Delivery. J Pharm Sci. 2012Feb;101(2):627-40
26. Helbok A, Rangger C, von Guggenberg E, Saba-Lepek M, Radolf T, Thurner G, Andreae F, Prassl R, Decristoforo C. Targeting properties of peptide-modified radiolabeled liposomal nanoparticles. Nanomedicine Nanotechnology, Biol Med. 2012;8(1):112-8
27. Su Z, Shi Y, Xiao Y, Sun M, Ping Q, Zong L, Li S, Niu J, Huang A, You W, Chen Y, Chen X, Fei J, Tian J. Effect of octreotide surface density on receptor-mediated endocytosis in vitro and anticancer efficacy of modified nanocarrier in vivo after optimization. Int J Pharm. 2013;447(1-2):281-92
28. Xiao Y, Jaskula-Sztul R, Javadi A, Xu W, Eide J, Dammalapati A, Kunnimalaiyaan M, Chen H, Gong S. Co-delivery of doxorubicin and siRNA using octreotide-conjugated gold nanorods for targeted neuroendocrine cancer therapy. Nanoscale. 2012;4(22):7185
29. Orocio-Rodríguez E, Ferro-Flores G, Santos-Cuevas CL, Ramírez F de M, Ocampo-García BE, Azorín-Vega E, Sánchez-García FM. Two Novel Nanosized Radiolabeled Analogues of Somatostatin for Neuroendocrine Tumor Imaging. J Nanosci Nanotechnol. 2015Jun;15(6):4159-69
30. Li X, Du X, Huo T, Liu X, Zhang S, Yuan F. Specific targeting of breast tumor by octreotide-conjugated ultrasmall superparamagnetic iron oxide particles using a clinical 3.0-tesla magnetic resonance scanner. Acta radiol. 2009;50(6):583-94
31. Jackson AW, Chandrasekharan P, Ramasamy B, Goggi J, Chuang KH, He T, Robins EG. Octreotide Functionalized Nano-Contrast Agent for Targeted Magnetic Resonance Imaging. Biomacromolecules. 2016;17(12):3902-10
32. Theodoropoulou M, Stalla GK. Somatostatin receptors: from signaling to clinical practice. Front Neuroendocrinol. 2013Aug;34(3):228-52
33. Paramonov VM, Mamaeva V, Sahlgren C, Rivero-Müller A. Genetically-encoded tools for cAMP probing and modulation in living systems. Front Pharmacol. 2015Sep15;6(September):1-21
34. Binkowski BF, Butler BL, Stecha PF, Eggers CT, Otto P, Zimmerman K, Vidugiris G, Wood MG, Encell LP, Fan F, Wood K V. A luminescent biosensor with increased dynamic range for intracellular cAMP. ACS Chem Biol. 2011Nov18;6(11):1193-7
35. Binkowski BF, Fan F, Wood K V. Luminescent biosensors for real-time monitoring of intracellular cAMP. Methods Mol Biol. 2011Jan;756:263-71
36. Trehan A, Rotgers E, Coffey ET, Huhtaniemi I, Rivero-Müller A. CANDLES, an assay for monitoring GPCR induced cAMP generation in cell cultures. Cell Commun Signal. 2014;12:1-17
37. Evers BM, Townsend CM, Upp JR, Allen E, Hurlbut SC, Kim SW, Rajaraman S, Singh P, Reubi JC, Thompson JC. Establishment and characterization of a human carcinoid in nude mice and effect of various agents on tumor growth. Gastroenterology. 1991Aug;101(2):303-11
38. Leu FP, Nandi M, Niu C. The effect of transforming growth factor beta on human neuroendocrine tumor BON cell proliferation and differentiation is mediated through somatostatin signaling. Mol Cancer Res. 2008Jun;6(6):1029-42
39. Sun L-C, Mackey LV, Luo J, Fuselier JA, Coy DH. Targeted chemotherapy using a cytotoxic somatostatin conjugate to inhibit tumor growth and metastasis in nude mice. Clin Med Oncol. 2008;2:491-9
40. Taelman VF, Radojewski P, Marincek N, Ben-Shlomo A, Grotzky A, Olariu CI, Perren A, Stettler C, Krause T, Meier LP, Cescato R, Walter MA. Upregulation of Key Molecules for Targeted Imaging and Therapy. J Nucl Med. 2016;57(11):1805-10
41. Seamon KB, Padgett W, Daly JW. Forskolin: unique diterpene activator of adenylate cyclase in membranes and in intact cells. Proc Natl Acad Sci U S A. 1981Jun;78(6):3363-7
42. Hurley JH. Structure, Mechanism, and Regulation of Mammalian Adenylyl Cyclase. J Biol Chem. 1999Mar19;274(12):7599-602
43. Insel PA, Ostrom RS. Forskolin as a tool for examining adenylyl cyclase expression, regulation, and G protein signaling. Cell Mol Neurobiol. 2003;23(3):305-14
44. Hill SJ, Williams C, May LT. Insights into GPCR pharmacology from the measurement of changes in intracellular cyclic AMP; advantages and pitfalls of differing methodologies. Br J Pharmacol. 2010Nov;161(6):1266-75
45. Lesche S, Lehmann D, Nagel F, Schmid HA, Schulz S. Differential effects of octreotide and pasireotide on somatostatin receptor internalization and trafficking in vitro. J Clin Endocrinol Metab. 2009Feb;94(2):654-61
46. Szymczak-Workman AL, Vignali KM, Vignali DAA. Design and construction of 2A peptide-linked multicistronic vectors. Cold Spring Harb Protoc. 2012;7(2):199-204
47. Taouji S, Dahan S, Bosse R, Chevet E. Current Screens Based on the AlphaScreenTM Technology for Deciphering Cell Signalling Pathways. Curr Genomics. 2009;10:93-101
48. Vale W, Rivier J, Ling N, Brown M. Biologic and immunologic activities and applications of somatostatin analogs. Metabolism. 1978Sep;27(9):1391-401
49. Bass RT, Buckwalter BL, Patel BP, Pausch MH, Price LA, Strnad J, Hadcock JR. Identification and characterization of novel somatostatin antagonists. Mol Pharmacol. 1996Oct;50(4):709-15
50. Janecka A, Zubrzycka M, Janecki T. Somatostatin analogs. J Pept Res. 2001Aug;58(2):91-107
51. Na DH, Murty SB, Lee KC, Thanoo BC, DeLuca PP. Preparation and stability of poly(ethylene glycol) (PEG)ylated octreotide for application to microsphere delivery. AAPS PharmSciTech. 2003Dec31;4(4):E72
52. Peng J, Qi X, Chen Y, Ma N, Zhang Z, Xing J, Zhu X, Li Z, Wu Z. Octreotide-conjugated PAMAM for targeted delivery to somatostatin receptors over-expressed tumor cells. J Drug Target. 2014Jun17;22(5):428-38
53. Desai D, Karaman DS, Prabhakar N, Tadayon S, Duchanoy A, Toivola DM, Rajput S, Näreoja T, Rosenholm JM. Design considerations for mesoporous silica nanoparticulate systems in facilitating biomedical applications. Mesoporous Biomater. 2014Jan1;1(1):16-43
54. Niemelä E, Desai D, Nkizinkiko Y, Eriksson JE, Rosenholm JM. Sugar-decorated mesoporous silica nanoparticles as delivery vehicles for the poorly soluble drug celastrol enables targeted induction of apoptosis in cancer cells. Eur J Pharm Biopharm. 2015Oct;96:11-21
55. Ginj M, Zhang H, Waser B, Cescato R, Wild D, Wang X, Erchegyi J, Rivier J, Mäcke HR, Reubi JC. Radiolabeled somatostatin receptor antagonists are preferable to agonists for in vivo peptide receptor targeting of tumors. Proc Natl Acad Sci U S A. 2006Oct31;103(44):16436-41
56. Feniuk W, Jarvie E, Luo J, Humphrey PPA. Selective somatostatin sst2 receptor blockade with the novel cyclic octapeptide, CYN-154806. Neuropharmacology. 2000;39(8):1443-50
57. Nunn C, Schoeffter P, Langenegger D, Hoyer D. Functional characterisation of the putative somatostatin sst2 receptor antagonist CYN 154806. Naunyn Schmiedebergs Arch Pharmacol. 2003;367(1):1-9
58. Djordjijevic D, Zhang J, Priam M, Viollet C, Gourdji D, Kordon C, Epelbaum J. Effect of 17beta-estradiol on somatostatin receptor expression and inhibitory effects on growth hormone and prolactin release in rat pituitary cell cultures. Endocrinology. 1998May;139(5):2272-7
59. Gratton SEA, Ropp PA, Pohlhaus PD, Luft JC, Madden VJ, Napier ME, DeSimone JM. The effect of particle design on cellular internalization pathways. Proc Natl Acad Sci U S A. 2008;105(33):11613-8
60. Jiang W, Kim BYS, Rutka JT, Chan WCW. Nanoparticle-mediated cellular response is size-dependent. Nat Nanotechnol. 2008;3(3):145-50
61. Lu F, Wu S-H, Hung Y, Mou C-Y. Size Effect on Cell Uptake in Well-Suspended, Uniform Mesoporous Silica Nanoparticles. Small. 2009;5(12):1408-13
62. Beck M, Mandal T, Buske C, Lindén M. Serum Protein Adsorption Enhances Active Leukemia Stem Cell Targeting of Mesoporous Silica Nanoparticles. ACS Appl Mater Interfaces. 2017;9(22):18566-74
63. Verma A, Stellacci F. Effect of surface properties on nanoparticle-cell interactions. Small. 2010Jan;6(1):12-21
64. Rodda AE, Meagher L, Nisbet DR, Forsythe JS. Specific control of cell-material interactions: Targeting cell receptors using ligand-functionalized polymer substrates. Prog Polym Sci. 2014Jul;39(7):1312-47
65. Jiang B, Yang J, Rahoui N, Taloub N, Huang YD. Functional polymer materials affecting cell attachment. Adv Colloid Interface Sci. 2017Dec;250:185-94
66. Patching SG. Surface plasmon resonance spectroscopy for characterisation of membrane protein-ligand interactions and its potential for drug discovery. Biochim Biophys Acta - Biomembr. 2014;1838(1):43-55
67. Draczkowski P, Matosiuk D, Jozwiak K. Isothermal titration calorimetry in membrane protein research. J Pharm Biomed Anal. 2014;87:313-25
68. Seidel SAI, Dijkman PM, Lea WA, van den Bogaart G, Jerabek-Willemsen M, Lazic A, Joseph JS, Srinivasan P, Baaske P, Simeonov A, Katritch I, Melo FA, Ladbury JE, Schreiber G, Watts A, Braun D, Duhr S. Microscale thermophoresis quantifies biomolecular interactions under previously challenging conditions. Methods. 2013;59(3):301-15
69. Wettschureck N, Offermanns S. Mammalian G proteins and their cell type specific functions. Physilological Rev. 2005:1159-204
70. Rosenholm JM, Meinander A, Peuhu E, Niemi R, Eriksson JE, Sahlgren C, Lindén M. Targeting of Porous Hybrid Silica Nanoparticles to Cancer Cells. ACS Nano. 2009Jan27;3(1):197-206
71. Zhang J, Desai D, Rosenholm JM. Tethered Lipid Bilayer Gates: Toward Extended Retention of Hydrophilic Cargo in Porous Nanocarriers. Adv Funct Mater. 2014Apr;24(16):2352-60
72. Kaku M, Nishiyama T, Yagawa K, Abe M. Establishment of a carcinoembryonic antigen-producing cell line from human pancreatic carcinoma. Gann. 1980Oct;71(5):596-601
73. Richards B, Skoletsky J, Shuber a P, Balfour R, Stern RC, Dorkin HL, Parad RB, Witt D, Klinger KW. Multiplex PCR amplification from the CFTR gene using DNA prepared from buccal brushes/swabs. Hum Mol Genet. 1993Feb;2(2):159-63
74. Rivero-Müller A, Lajić S, Huhtaniemi I. Assisted large fragment insertion by Red/ET-recombination (ALFIRE)-an alternative and enhanced method for large fragment recombineering. Nucleic Acids Res. 2007;35(10):e78
75. Gibson DG, Young L, Chuang R-Y, Venter JC, Hutchison CA, Smith HO. Enzymatic assembly of DNA molecules up to several hundred kilobases. Nat Methods. 2009May;6(5):343-5
76. Burden RL, Faires DJ, Burden AM. Numerical Analysis. 10th ed. Brooks Cole. 2015:896 p
Author contact
![]() Corresponding authors: csahlgrefi; adorivfi
Corresponding authors: csahlgrefi; adorivfi