- Volume 10; 2026
- Volume 9; 2025
- Volume 8; 2024
- Volume 7; 2023
- Volume 6; 2022
- Archive
- Editorial Board
- Cover Suggestion
- Index & Coverage
- Special Issues
1. Introduction
2. Results
3. Discussion and Conclusion
4. Materials and methods
Abbreviations
Acknowledgements
Supplementary Material
References
International Journal of Biological Sciences
International Journal of Medical Sciences

 Global reach, higher impact
Nanotheranostics 2018; 2(4):371-386. doi:10.7150/ntno.27308 This issue Cite
Research Paper
Functionalized MoS2 Nanosheets as Multi-Gene Delivery Vehicles for In Vivo Pancreatic Cancer Therapy
Feng Yin1,2#, Tommy Anderson2#, Nishtha Panwar2#, Kang Zhang2, Swee Chuan Tjin2, Beng Koon Ng2, Ho Sup Yoon3, Junle Qu4, Ken-Tye Yong 2 ![]()
1. School of Chemical Biology and Biotechnology, Peking University Shenzhen Graduate School, Shenzhen, 518055, China
2. School of Electrical and Electronic Engineering, Nanyang Technological University, Singapore 639798, Singapore
3. Division of Structural Biology & Biochemistry, School of Biological Sciences, Nanyang Technological University, Singapore 639798, Singapore
4. Key Laboratory of Optoelectronic Devices and Systems of Ministry of Education and Guangdong Province, College of Optoelectronic Engineering, Shenzhen University, Shenzhen, 518060, People's Republic of China
# Equal contribution
Received 2018-5-17; Accepted 2018-8-1; Published 2018-8-25
Abstract

Transition metal dichalcogenides (TMDCs) are categorized as novel two-dimensional (2D) nanomaterials with unique physical and chemical properties, bearing varied applications in medical and materials sciences. However, only a few works report the application of TMDCs for gene therapy in cancer treatment. Here, we engineer a multi-gene delivery system based on functionalized monolayer MoS2, which can co-deliver HDAC1 and KRAS small interfering RNAs (siRNAs) to Panc-1 cancer cells for combinational cancer therapy. The synergistic effect of gene silencing therapy and NIR phototherapy is demonstrated by inhibition of both genes, in vitro cell growth rate, and in vivo tumor volume growth rate, exemplifying pre-eminent anticancer efficacy. This anti-tumor effect is a result of the photothermal effect of MoS2 induced by NIR excitation and inactivation of HDAC1 and KRAS genes, which consequently bring about apoptosis, inhibit migration, and induce cell cycle arrest in the treated Panc-1 cells. Moreover, good biocompatibility and reduced cytotoxicity of MoS2-based nanocarriers enable their metabolism within in vitro and in vivo mouse models over a prolonged duration without any evident ill-effects. In summary, we demonstrate the promising potential of low-toxicity, functionalized MoS2 nanocarriers as a biocompatible gene delivery system for in vivo pancreatic adenocarcinoma therapy.
Keywords: MoS2, HDAC1, KRAS, gene delivery, pancreatic cancer cells
1. Introduction
A multitude of nanomaterials have been designed over the past decades as they exhibit promising potential for cancer theranostics applications, both in vitro and in vivo [1-3]. Owing to the unique properties [4, 5] such as tunable particle size, multi-functionalized surface, high drug-loading capacity and good biocompatibility, great effort has been made to investigate the potential of nanomaterials for applications in the biomedical field. Numerous kinds of nanomaterials, such as liposomes [6], carbon nanomaterials [7], silica nanoparticles [8], metal-based nanoparticles [3], and quantum dots [9, 10] have been used in biomedical applications. Compared to these nanomaterials, 2D nanomaterials possess exceptional chemical, optical, and electronic properties and are thus, being considered as novel therapeutic agents for biomedicine, especially for cancer treatment [11]. There have been some particularly interesting reports that demonstrate the encouraging potential of 2D nanomaterial theranostics in the pre-clinical area and targeted delivery of cancer therapeutics [12-17].
Since its discovery [18], graphene has become a well-known 2D nanomaterial extensively used in various fields, including solar cells [19], sensors [20], electronics [21], and energy storage [22]. Subsequently, functionalized graphene nanosheets with biocompatible polyethylene glycol (PEG) have been applied in cancer therapy successfully [23], and were used to generate tumor ablation by utilizing the photothermal effect of graphene [24]. Furthermore, the large surface area entitles graphene as the ideal drug delivery system for various therapeutic agents. In the recent years, another class of 2D nanomaterials, TMDCs, have become subjects of great interest for applications in electronics and optics [25]. Similar to graphene, TMDCs possess a quasi 2D layered structure, typically composed of MX2, in which M represents a transition metal atom (Mo, W, or V) and X represents a chalcogen atom (S, Se, or Te), forming an X-M-X sandwich structure (Scheme 1). As a typical layered transition metal, Molybdenum disulfide (MoS2) is a promising nanomaterial and considered to potentially surpass graphene in sensors and electronics [26, 27]. Moreover, due to their structural similarity to graphene, MoS2 nanosheets have also been attracting likewise interest for their potential application in biomedical field. Recently, MoS2-based DNA sensor was used to detect DNA and small molecules [28], and functionalized MoS2 nanosheets were employed as drug delivery agents for cancer treatment [11]. Nevertheless, there are only a handful of reports describing the theranostics applications of MoS2 [11, 29-32] and thus, further investigation for exploring their biomedical applications, including gene therapy, is necessary.
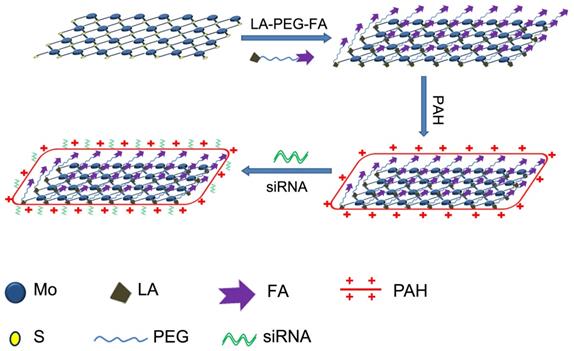
Schematic illustration of the formation of MoS2/LA/PEG/FA/PAH and the gene loading by the engineered MoS2-based nanocarriers.
Gene therapy is a biomedical strategy with the goals of modifying the genetic disease at its source by delivering nucleic acid into cells [33]. The most common form of gene therapy is the use of corrective genes to replace a mutated gene, often called as gene silencing, wherein the expression of a certain gene gets suppressed. Since the discovery of recombinant DNA as a revolutionary tool for gene therapy in the 1970s [34, 35], gene therapy has attracted great interest and has been extensively utilized for therapeutic effect in many diseases, for example, cancer [36], immunodeficiency diseases [37], diabetes [38], and cardiovascular diseases [39]. Among the several kinds of approaches in gene therapy, RNA interference (RNAi) stands out due to its fast experimental period, feasible operation, dose-dependent manner, and high efficiency of gene knockdown [40, 41]. This technique uses a double-stranded siRNA to cause sequence-specific gene silencing at the post-transcriptional level [42]. The siRNA hybridizes with the mRNA sequence of the targeted gene and then activates nucleolytic degradation of the targeted mRNA by RNase enzyme in cells [43, 44]. The RNAi phenomenon is highly potent in the down-regulation of the targeted gene expression, however, the siRNA in its naked form is highly unstable [45] and thus, is not readily delivered to the target site of interest [46]. These drawbacks thus, prevent further applications of RNAi in gene therapy. To overcome these hurdles for achieving successful clinical trials, various nanomaterials, such as liposomes [47], gold nanoparticles [48], and silica nanoparticles [49], are being investigated as gene delivery systems.
In our previous work, we utilized gold nanorods (AuNRs) as nanocarriers to co-deliver siRNA and anticancer drug, Doxorubicin, to study both in vitro and in vivo combinatorial therapy of pancreatic cancer [3]. We demonstrated superior anticancer efficacy resulting from the interactive chemotherapeutic, gene suppression, and photothermal therapy [3]. Compared to AuNRs-based nanocarriers, TMDCs nanomaterials possess large specific surface area and exceptional surface-to-volume ratio, which result in incomparably high loading capacity for drug delivery. In comparison to other nanomaterials, TMDCs possess advantages due to their optical properties, which enable superior photothermal effects to nanomaterials like graphene [11,50]. In addition, low toxicity of TMDCs in comparison to graphene [51] signifies a promising alternative NIR photothermal theranostic agent. In this work, we fabricate a multi-gene delivery system comprising of PEGylated MoS2 nanosheets that can successfully co-deliver HDAC1 and KRAS siRNAs (against a G12D mutant KRAS gene for Panc-1 cells) for in vitro pancreatic cancer therapy. The unique function of Histone deacetylase 1 (HDAC1) in sustaining the pluripotency of embryonic and cancer stem cells underlines its important role in epigenetics [52, 53]. Furthermore, the appreciable expression of HDAC1 in pancreatic cancer and other forms of cancers [54] promote cell transformation, survival, invasion, and metastasis [55-57]. Thus, HDAC1 is considered as a promising target for cancer therapy. Moreover, the mutational KRAS gene has been shown to predominate more than 90% of pancreatic cancers and is thus, a major target for addressing cancer therapy [58]. In this work, we utilized functionalized MoS2 nanosheets with folic acid (FA)-polyethyleneglycol (PEG) polymers and polyallylamine hydrochloride (PAH) for complexation with siRNAs. The surface chemistry of the nanosheets allowed their easy internalization in Panc-1 cells, and the synergistic effect of gene therapy and photothermal effect contributed by the MoS2 nanosheets-mediated co-delivery was able to impede the pancreatic cancer cell growth rate by 70%. Interestingly, the synergistic effect of the MoS2 nanosheets in the presence of NIR light reduced the in vivo tumor volume growth rate by 80%. On the other hand, we did not observe any significant weight changes in the mice treated with PEGylated MoS2 nanoformulation. Mice voluntary cage-wheel exercise showed no changes in the learning ability and movements of the treated mice vis-a-vis the untreated mice. Moreover, the major organs of treated mice did not exhibit any deformations or side-effects. Thus, our work establishes the rooted potential of MoS2 nanosheets as a novel and low-toxic multi-gene therapy nanoplatform for targeted gene delivery and photothermal therapy of pancreatic cancer.
2. Results
As a graphene analogue in 2D nanomaterials, the layered structure of MoS2 comprises of a 2D sandwich-type S-Mo-S structure (Scheme 1). The most common method to prepare MoS2 nanosheets is the chemical exfoliation method with different lithium intercalating agents according to the reported studies [11, 27]. Whilst naked MoS2 exhibits solubility in water, they are unstable in buffer solution and functionalization is necessary to improve their solubility to form stable solution [11]. Scheme 1 illustrates the functionalization procedure of MoS2 nanosheets. We used six different MoS2-based nanoformulations in our work: (i) naked MoS2 nanosheets functionalized with lipoic acid (LA)-modified PEG (MoS2/PEG); (ii) naked MoS2 nanosheets functionalized with FA and LA-modified PEG (MoS2/PEG/FA); (iii) MoS2/PEG formulation modified with PAH polymer (MoS2/LA/PEG/PAH, MoS2); (iv) MoS2/PEG/FA formulation modified with PAH polymer (MoS2/PEG/FA/PAH, FA/MoS2); (v) nanoplexes of siRNA and MoS2/PEG/PAH (MoS2/siRNA); (vi) nanoplexes of siRNA and MoS2/PEG/FA/PAH (FA/MoS2/siRNA).
2.1. Synthesis of multifunctional MoS2 nanosheets-based siRNA delivery system
For our experiments, we purchased the monolayer 2D MoS2 nanosheets from 2D-Semiconductors Inc, which exhibited thickness from 1-2.6 nm and lateral size ranging from 58-88 nm, as shown in Figure 1A. For their application in biological media, the MoS2 nanosheets have to be functionalized with PEG to improve its biocompatibility. Due to its chemical structure, functionalization of MoS2 with PEG and folic acid-PEG were performed with LA-modified PEG (LA-PEG) or FA-modified LA-PEG (LA-PEG-FA) in order to allow the disulfide moiety to bind to the defect sites in MoS2 [11, 50]. Upon functionalization with LA-PEG-FA, the dimensions of the MoS2/PEG/FA were examined. As shown in Figure 1B, the functionalized MoS2 exhibited thickness from 1.8-4.3 nm and lateral size from 42-100 nm. This increased thickness and lateral dimension most likely originated from addition of the PEG/FA groups on the surface of MoS2. FT-IR spectrum of naked MoS2, LA-PEG-FA, and the functionalized MoS2 are displayed in Figure 1C. Unlike naked MoS2, the functionalized MoS2 exhibited notable absorption peaks at 2916 cm-1 and 1101 cm-1. The peaks at 2916 cm-1 and 1101 cm-1 correspond to C-H and C-O bonds in PEG chains in LA-PEG-FA, respectively. Hence, the presence of these peaks further indicates that successful conjugation of LA-PEG-FA onto the MoS2 nanosheets is achieved in MoS2/PEG/FA.
Characterization of the engineered MoS2-based nanocarriers. AFM characterization of (A) MoS2, (B) MoS2/PEG/FA. (C) FT-IR spectra of naked MoS2, LA-PEG-FA, and MoS2/PEG/FA. (D) Absorption spectra of different MoS2-based nanocarriers. (E) Hydrodynamic size and (F) surface zeta potential of the different complex of MoS2. (G) The quantitative analysis of gene loading ability of MoS2/PEG/FA/PAH nanocarriers. Gel retardation quantitative analysis of siRNA loading by MoS2/PEG/FA/PAH, using free siRNA as reference. The mass ratio between MoS2/PEG/FA/PAH (1 mg/mL) and siRNA (130 μg/mL) are set to be 0.5:1.3, 1:1.3, 2:1.3, 4:1.3 and 6:1.3, respectively. All experiments are performed in duplicates with consistent results. Values are means±SEM, n=3.
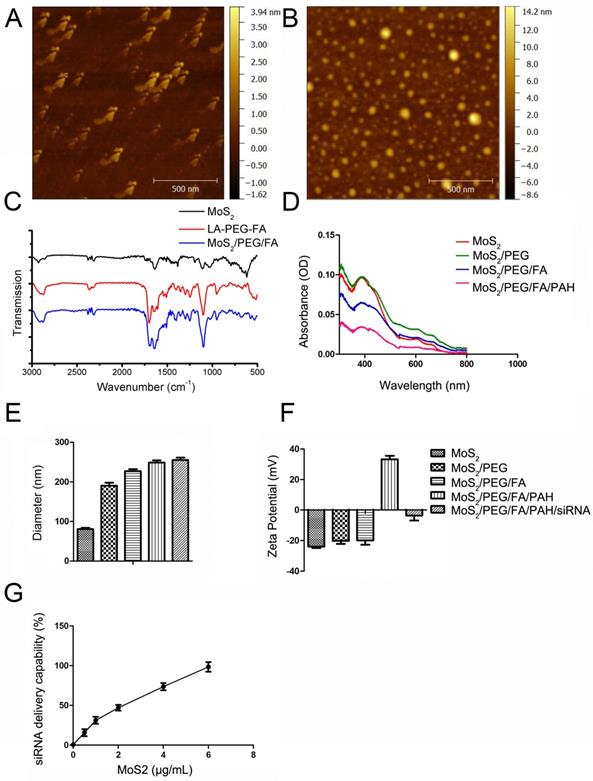
To enable conjugation and delivery of siRNA molecules, we functionalized PEGylated MoS2 with PAH polymer to obtain positively-charged MoS2/PEG/PAH (MoS2) or MoS2/PEG/FA/PAH (FA/MoS2). The absorbance spectra of MoS2 does not change by PEG or PAH functionalizations (Figure 1D). We used the dynamic light scattering (DLS) technique to measure the hydrodynamic diameter of the naked MoS2 nanosheets in DI water, which was estimated to be 90.84 ± 3.76 nm (Figure 1E). The measured zeta potential of the naked MoS2 nanosheets in DI water was -23.86 ± 1.94 mV (Figure 1F). The values of hydrodynamic diameter and zeta potential varied according to functionalization of different materials on the MoS2 surface. We noted an increase in the hydrodynamic size of MoS2 nanosheets after functionalization with LA-PEG and LA-PEG-FA, in agreement with the atomic force microscope (AFM) characterization results. Further functionalization with PAH was successful in modifying the surface charge of the nanosheets, as observed in the change of zeta potential from negative to positive (Figure 1F). Complexation with siRNA molecules by electrostatic interaction introduce negatively-charged molecules onto the surface of the nanocomplexes, resulting in negatively-charged surface. We noted increments in the zeta potential and hydrodynamic diameter of the complex as we prolonged the incubation time between MoS2/PEG/FA and PAH (Figure S1). Based on these results, we chose 36 hours as the optimized time to mix MoS2/PEG/FA and PAH. Figure 1G and Figure S2 represent the results of gel retardation study used to confirm the mass of FA/MoS2 nanosheets that entirely bind with a given quantity of siRNA. As we increased the amount of FA/MoS2 nanosheets in the MoS2-siRNA nanocomplex, a considerable decline in the quantity of free siRNA molecules was observed. Hence, we optimized the mass ratio between FA/MoS2 and siRNA molecules to be 6 μg: 1.3 μg on the basis of the gel retardation study, and we have used this ratio for all the in vitro experiments.
2.2. Microscopy fluorescent images of PEGylated or FA-PEGylated MoS2-siRNA nanocomplexes in Panc-1 cells
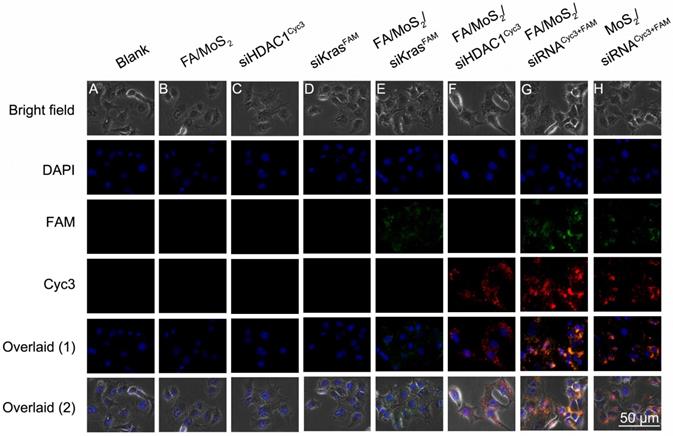
The overexpression of HDAC1 in most malignant forms of tumors (for e.g., pancreatic cancer, colorectal cancer, lung cancer, etc.), is known to activate specific-kinase signaling pathways in the tumor microenvironment that lead to increased cell proliferation and metastasis. Therefore, in this report, we investigate the feasibility of using a PEGylated MoS2 nanosheet platform to co-deliver HDAC1 and KRAS siRNAs in Panc-1 cancer cells in vitro and evaluate its efficiency as a multi-gene delivery system. First, we treated the Panc-1 cells with various MoS2 nanoformulations and examined them after 4 hours under a fluorescence microscope to observe transfection and distribution of HDAC1 siRNACyc3 and KRAS siRNAFAM inside the cells (Figure 2). The Cyc3 (red, Figure 2E) and FAM (green, Figure 2F) fluorescence signals demonstrate the successful delivery of the two kinds of siRNA into Panc-1 cells by FA/MoS2 nanosheets. Figure 2G depicts the successful co-delivery of HDAC1 and KRAS siRNAs into Panc-1 cells, mediated by FA/MoS2 nanoformulations. In contrast, we observed weaker fluorescence signals from Panc-1 cells treated with FA-unconjugated MoS2 nanoformulations (Figure 2H). Expectedly, the cells treated with PBS (Figure 2A), FA/MoS2 (Figure 2B), free HDAC1 siRNACyc3 (Figure 2C), and free KRAS siRNAFAM (Figure 2D) showed negligible fluorescence. These fluorescent images indicate that the use of MoS2 nanoformulations can successfully transport siRNAs into cells and the cellular uptake of MoS2 nanoformulations can be effectively increased by FA conjugation.
Fluorescent images of Panc-1 cells treated with different MoS2/siRNA nanocomplex formulations four hours after treatment. (A) PBS as blank control, (B) MoS2/PEG/PAH/FA (FA/MoS2) and (C) free KRAS-siRNAFAM (siKRASFAM) and (D) free HDAC1-siRNACyc3 (siHDAC1Cyc3) as negative control, the single delivery of KRAS-siRNAFAM (E) or HDAC1-siRNACyc3 (F) by MoS2/PEG/PAH/FA (FA/MoS2), and the co-delivery of KRAS-siRNAFAM and HDAC1-siRNACyc3 by (G) MoS2/PEG/PAH/FA (MoS2/FA) or (H) MoS2/PEG/PAH (MoS2). The cell nucleus is stained with DAPI (pseudo-colored in blue) and signals from FAM and Cyc3 are assigned in green and red, respectively.
2.3. Flow cytometry analysis of PEGylated or FA-PEGylated MoS2-siRNA nanocomplexes in Panc-1 cells
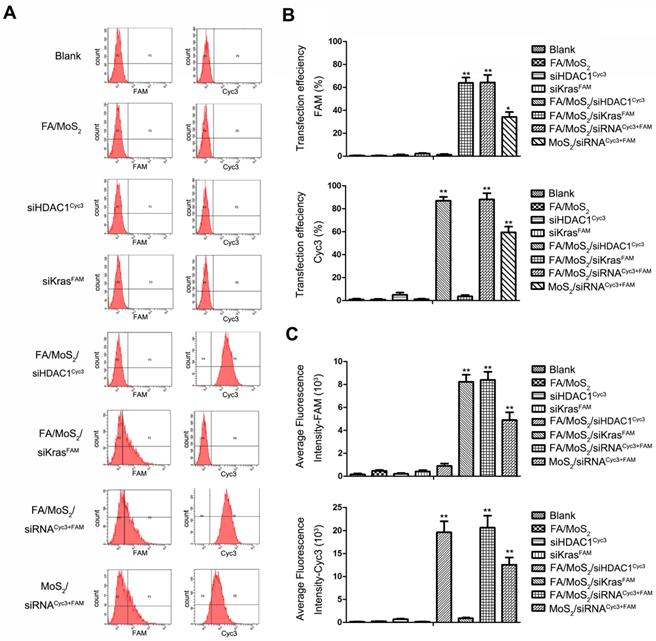
To assess the HDAC1 siRNACyc3 and KRAS siRNAFAM delivery efficiency of the MoS2 nanoformulations, we performed flow cytometry analysis. Figure 3A depicts the fluorescent snapshots of Panc-1 cells treated with different MoS2 nanoformulations. Negative controls were: Panc 1-PBS, Panc 1-FA/MoS2, Panc 1-HDAC1 siRNACyc3, or Panc 1-KRAS siRNAFAM. While the Panc-1 cells treated with FA/MoS2/siRNACyc3+FAM nanoformulations exhibited strongest FAM and Cyc3 fluorescence signals with 65% and 90% transfection efficiencies, respectively, the cells treated with MoS2/siRNACyc3+FAM nanoformulations yielded 35% and 60% transfection efficiencies, respectively (Figures 3B-C). These differences signify the role of FA conjugation in the cellular uptake of MoS2 nanoformulations. Contrary to these results, the cells treated with negative controls showed negligible fluorescent signals. Moreover, these results compliment the cell fluorescence microscopy analysis shown in Figure 2.
Flow cytometry evaluations on the transfection efficiencies of Panc-1 cells treated with different MoS2/siRNA nanoparticle formulations. Panc-1 cells are treated with PBS (as blank), MoS2/PEG/PAH/FA (FA/MoS2), free KRAS-siRNAFAM, free HDAC1-siRNACyc3, single delivery of KRAS-siRNAFAM (FA/MoS2/siKRASFAM) or HDAC1-siRNACyc3 (FA/MoS2/ siHDAC1Cyc3) by FA/MoS2, co-delivery of KRAS-siRNAFAM and HDAC1-siRNACyc3 by FA/MoS2 or MoS2. (A) Representative dots plot of flow cytometry assays, where the x-axis and the y-axis show the fluorescent intensities of FAM and Cyc3, respectively. (B) Transfection efficiency and (C) average fluorescence intensity from experiments shown in (A). Values are means ± SEM, n = 3; **, P < 0.01 vs Control, FA/MoS2, siRNAFAM and siRNACyc3.
2.4. Gene expression analysis of Panc-1 cells post treatment with MoS2 nanoformulations
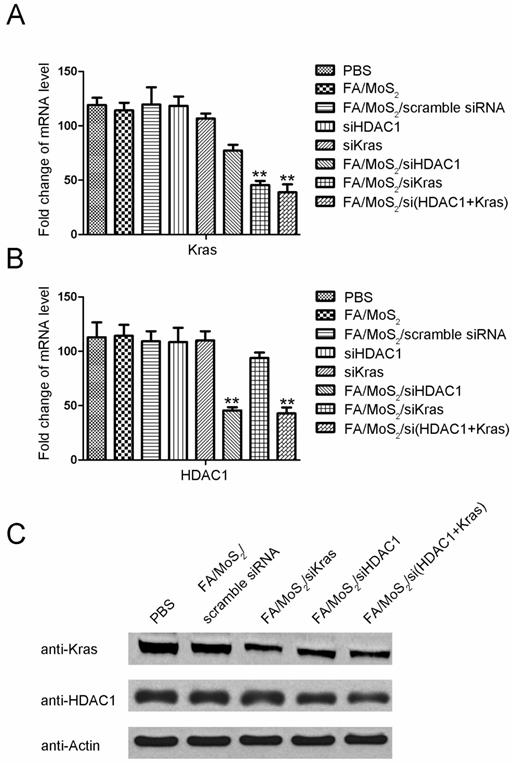
Since the overexpression of HDAC1 and mutant KRAS mRNA results in uncontrolled proliferation of pancreatic cancer cells, our goal in this study is to realize MoS2 nanoformulations-mediated delivery of specific siRNAs into Panc-1 cells which can target HDAC1 or mutant KRAS gene. Consistent with the flow cytometry analysis, the results in Figure 4 demonstrate both HDAC1 and KRAS gene silencing in MoS2 nanoformulations-treated Panc-1 cells. While the cells treated with negative controls exhibited negligible changes in HDAC1 or KRAS mRNA and protein levels, we observed a notable suppression of HDAC1 or KRAS gene expression in the cells treated with FA/MoS2/HDAC1 siRNA, FA/MoS2/KRAS siRNA, or FA/MoS2/HDAC1+KRAS siRNAs with gene silencing effect around 50% for each gene. Thus, the results of RT-PCR and Western Blotting analysis reveal the potential of MoS2-based nanoformulations as efficient nanovehicles of multiple siRNAs to address targeted gene knockdown in pancreatic cells.
Gene expression evaluations of Panc-1 cells treated with different MoS2-based nanoparticle formulations. Panc-1 cells are treated with PBS, FA/MoS2, FA/MoS2/scramble siRNA, free KRAS siRNA, free HDAC1 siRNA, FA/MoS2/siKRAS, FA/MoS2/siHDAC1 and FA/MoS2/si(KRAS+HDAC1) for 4 hours, then all the cells are washed with PBS and re-incubated in fresh cell medium for additional 68 hours. (A-B) mRNA relative expression levels detected by RT-PCR. (C) Protein relative expression levels detected by Western Blotting. Actin is used as the protein loading control for samples. Values are means ± SEM, n = 3; **, P < 0.01 vs Control, FA/MoS2 and free siRNA.
2.5. Viability of Panc-1 cells post treatment with MoS2 nanoformulations
Due to its overexpression in most malignant tumors, HDAC1 is a driving factor in sustaining the pluripotency of cancer stem cells and regulating vital movements of cancer cells (survival, invasion, metastasis, etc.) [52]. Meanwhile, the mutational oncogene KRAS exists in almost all pancreatic cancers, which regulates cell proliferation, transformation, and apoptosis [59]. The ability of MoS2 nanoformulations-mediated delivery of HDAC1 or KRAS siRNA to suppress the expression of HDAC1 or KRAS gene in Panc-1 cells is sufficiently established by the gene knockdown results (Figure 4).
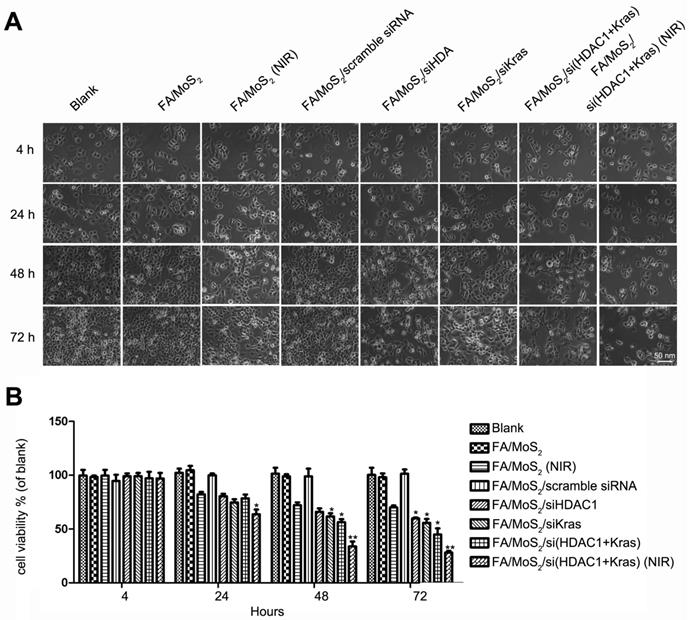
Subsequently, we further examined the effect of MoS2 nanoformulations on cell inhibition (Figure 5 and Figure S3). We treated Panc-1 cells with varying concentrations of FA/MoS2/PEG/PAH (5 μg mL-1 to 200 μg mL-1) and recorded around 80% cell viability even at 200 μg mL-1 concentration 72 hours post treatment (Figure S3). Hence, PEGylated MoS2-based nanocarriers strongly demonstrate good biocompatibility and low-toxicity. Furthermore, we observed minor cell growth inhibition upon treatment with FA/MoS2 or FA/MoS2/scramble siRNA nanoformulations. In contrast, we recorded obvious inhibition in cases of FA/MoS2/HDAC1 siRNA (62.15±1.23%), FA/MoS2/KRAS siRNA (58.34±3.54%), and FA/MoS2/HDAC1+KRAS siRNA (53.34±4.71%). We can thus infer that the co-delivery of HDAC1 and KRAS siRNAs caused a stronger inhibition rate of Panc-1 cell growth. In addition, the strong NIR absorbance and typical optical properties of MoS2 nanosheets [50] endow them as potent representatives for photothermal therapy, and hence, we subsequently investigate the anti-proliferative effects of the combination of MoS2 nanoformulation and NIR light. Upon irradiation with NIR light, MoS2 solution exhibit increase in temperature, which was observed in a concentration-dependent manner (Figure S4). For this study, we treated Panc-1 cells with FA/MoS2 or FA/MoS2/HDAC1+KRAS siRNA nanoformulations for 4 hours, and then exposed them under 808 nm NIR light for 5 minutes. In the additional 72 hours, we observed 40% inhibition rate for FA/MoS2 under NIR light, and the strongest inhibition rate (over 70%) for the nanoformulation, FA/MoS2/HDAC1+KRAS siRNA under NIR light. In addition, the possibility of enhanced MoS2 release from endosome and release of genetic material from nanocarriers upon irradiation of NIR light might also contribute into the enhanced therapeutic effect of the MoS2 nanosheets carriers [60]. These results suggest that both HDAC1 and KRAS genes are prospective candidates for gene therapy in pancreatic cancer. Furthermore, the combination of gene therapy and photothermal effect demonstrates synergistic effects for pancreatic cancer treatment.
Cell viability tests of different MoS2-based formulations. The growth of Panc-1 cells is inhibited by FA/MoS2/siRNA nanocomplex with NIR light. Panc-1 cells are treated with PBS, FA/MoS2, FA/MoS2 with NIR light, FA/MoS2/scramble siRNA, FA/MoS2/siKRAS, FA/MoS2/siHDAC1, FA/MoS2/si(KRAS+HDAC1) and FA/MoS2/si(KRAS+HDAC1) with NIR light for 4 hours, then all the cells are washed with PBS and re-incubated in fresh cell medium for designated time. Phase contrast microscope images (A) and relative cell viabilities (B) of Panc-1 cells treated with different MoS2/siRNA nanocomplex formulations without or with NIR light for 4, 24, 48, and 72 hours. Data are presented as the means±SEM of triplicate experiment.*, P < 0.05, **, P < 0.01 vs PBS (as blank) and FA/MoS2.
2.6. Cell Migration Test post treatment with different MoS2 nanoformulations
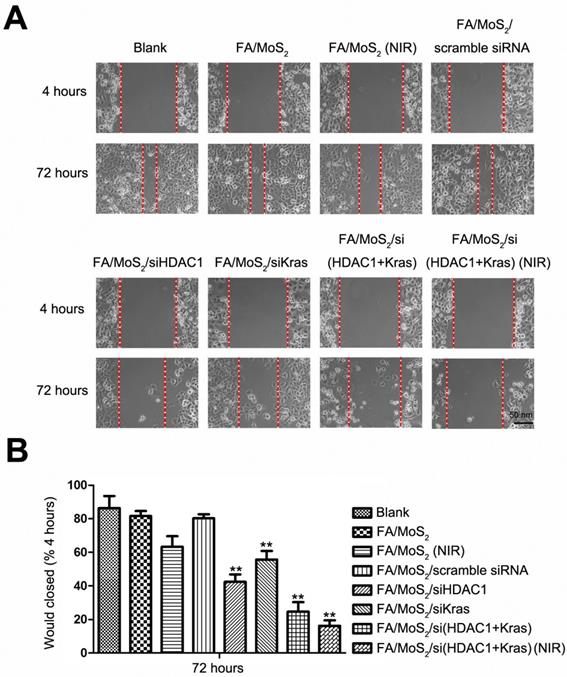
Collective cell migration is the process of a large scale coordinated movement of cells, which form the basis of invasion and metastasis in malignant tumors [61]. To study the effect of HDAC1 and KRAS genes in collective cell migration, we performed the wound healing migration assay [62] in Panc-1 cells treated with different MoS2 and siRNA nanoformulations (Figure 6). Briefly, we seeded Panc-1 cells in 6-well plates and treated with PBS, FA/MoS2, FA/MoS2 with NIR light, FA/MoS2/scramble siRNA, FA/MoS2/HDAC1 siRNA, FA/MoS2/KRAS siRNA, FA/MoS2/(HDAC1+KRAS) siRNA, or FA/MoS2/(HDAC1+KRAS) siRNA with NIR light, respectively. Thereafter, the cells were wounded by manual scraping four hours post treatment to produce a gap and incubated for additional 68 hours. Compared with the initial wound window width, the 72 hours wound-closure of cells treated with PBS, FA/MoS2, or FA/MoS2/scramble siRNA reached 86.37±6.43%, 81.59±2.71%, or 80.25±2.05%, respectively, while the cells treated with FA/MoS2 with NIR light, FA/MoS2/HDAC1 siRNA, FA/MoS2/KRAS siRNA, FA/MoS2/(HDAC1+KRAS) siRNA or FA/MoS2/(HDAC1+KRAS) siRNA with NIR light showed obvious reduction in the wound healing process. The wound healing of cells transfected with both HDAC1 and KRAS siRNAs was much slower than that of cells transfected with either HDAC1 or KRAS siRNA. Interestingly, the wound healing process was most predominantly suppressed in the cells treated with FA/MoS2/si(HDAC1+KRAS) and NIR light. The wound closed to around 16.31±2.49% of the initial wound window width post 72 hours. These results pressingly suggest that the synergistic effect of photothermal therapy and MoS2 nanoformulations-mediated co-delivery of HDAC1 and KRAS siRNA significantly decreases the migration ability of pancreatic cancer cells.
Wound healing migration assay in Panc-1 cell culture treated with different MoS2-based nanoparticle formulations. (A) Phase contrast microscope images of the wound healing process monitored Panc-1 cells treated with PBS, FA/MoS2, FA/MoS2 with NIR light, FA/MoS2/scramble siRNA, FA/MoS2/siKRAS, FA/MoS2/siHDAC1, FA/MoS2/si(KRAS+HDAC1) and FA/MoS2/si(KRAS+HDAC1) with NIR light at 4 and 72 hours. The gap is produced by scraping of the cell monolayer with a 200-μm micropipette tip. (B) Quantitative evaluation by measuring the width of the gap distance after treatment, values are normalized by the 4 hours wound gap width (as initial width). Data are presented as the means±SEM of triplicate experiments. **, P<0.01 vs PBS (as blank) and FA/MoS2.
2.7. In vivo Assessment of Antitumor activities of MoS2-based nanoformulations
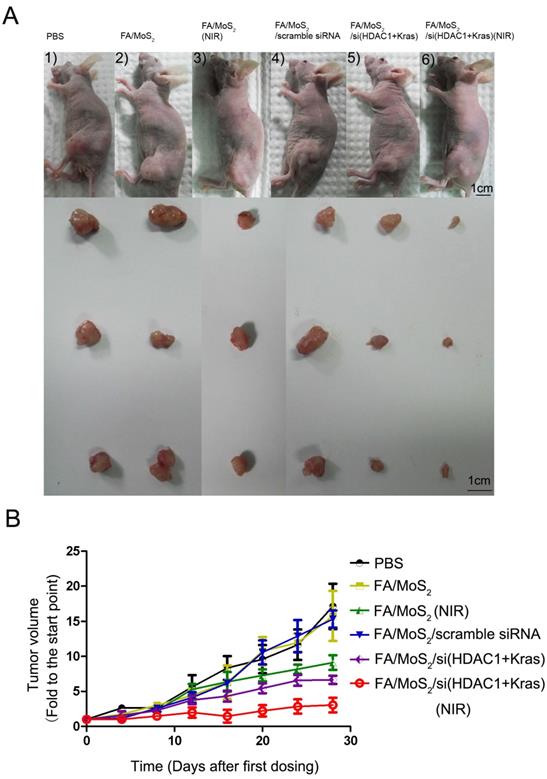
To evaluate the tumor growth suppression effect of MoS2-based nanoformulations in vivo, tumor-bearing mice were treated with different MoS2 nanoformulations (Figure 7). The mice treated with FA/MoS2 and NIR light (Figure 7A-3) or FA/MoS2/siRNA(HDAC1+KRAS) (Figure 7A-5) exhibited 47% and 56% tumor volume growth rate, respectively. Furthermore, the combination of FA/MoS2/siRNA(HDAC1+KRAS) and NIR light irradiation (Figure 7A-6) yielded the highest 78% suppression of in vivo tumor growth effect. Tumors-bearing mice treated with PBS (Figure 7A-1), FA/MoS2 (Figure 7A-2), or FA/MoS2/scramble siRNA (Figure 7A-3) exhibited negligible inhibition of tumor growth. The tumor weights in Figure S5 also demonstrated that the combination of FA/MoS2/siRNA(HDAC1+KRAS) and NIR light irradiation resulted in the strongest suppression of tumor growth. It is worth mentioning that there were minimal changes in mice treated with different MoS2 nanoformulations during the examination period (Figure S6). In addition, we examined gene knockdown efficiency of MoS2-based nanoformulations in vivo. As shown in Figure S7, tumor tissues were obtained at day 28 and are prepared for RT-PCR. In agreement with the in vitro results, Figure 5 shows suppression of HDAC1 and KRAS expression by FA/MoS2/siRNA(HDAC1+KRAS) with or without NIR light. Therefore, the in vivo tumor inhibition assay clearly demonstrates the pivotal role of both HDAC1 and KRAS genes in driving pancreatic tumor growth, and that they both might be potential target genes for pancreatic cancer treatment.
Antitumor activities of MoS2-based nanoparticle formulations in a Panc-1 xenograft animal model. (A) Representative images of mouse and tumor tissues treated with (1) PBS, (2) FA/MoS2, (3) FA/MoS2 with NIR light, (4) FA/MoS2/scramble siRNA, (5) FA/MoS2/si(KRAS+HDAC1) or (6) FA/MoS2/si(KRAS+HDAC1) with NIR light. Mice treated by FA/MoS2/si(KRAS+HDAC1) with NIR light in the last group exhibited the smallest tumors. (B) Relative changes in tumor volume versus time of mice treated by PBS, FA/MoS2, FA/MoS2 with NIR light, FA/MoS2/scramble siRNA, FA/MoS2/si(KRAS+HDAC1) or FA/MoS2/si(KRAS+HDAC1) with NIR light, respectively. Relative tumor volume is defined as (V-V0)/V0, where V and V0 indicate the tumor volume on a particular day and day 0, respectively. Error bars represent SEMs for triplicate data. Mean tumor volumes are analysed using one-way ANOVA. Values are means ± SEM, n=3-5 tumors.
2.8. In vivo toxicity test of MoS2 nanoformulations
The results of the in vitro and in vivo studies substantiate the promising feasibility of PEGylated MoS2-based nanosheets as an efficient siRNA delivery system for pancreatic cancer therapy. However, the successful use of such nanomaterials for clinical therapeutic applications in vivo cannot be realized without their toxicity assessments and time-bound harmless elimination from the body. We therefore, conducted a mice voluntary cage-wheel exercise assay, an ICP-MS (Inductively coupled plasma mass spectrometry) assay, and performed histological analyses to examine the in vivo toxicity and biodistribution of MoS2 nanoformulations. The effect of MoS2 nanoformulations on the motor learning ability of mice was first investigated through a mice voluntary cage-wheel exercise assay (Figure S8). For this, we randomly divided C57Bl/6 mice into two groups and subcutaneously injected them with 50 mg kg-1 of PBS or FA/MoS2. Starting from day 0 through day 20 post injection, a steady rise in the voluntary running cycles of both the groups was observed. Moreover, the negligible changes of mice treated with different FA/MoS2 nanoformulations were consistent with the results in Figure S6.
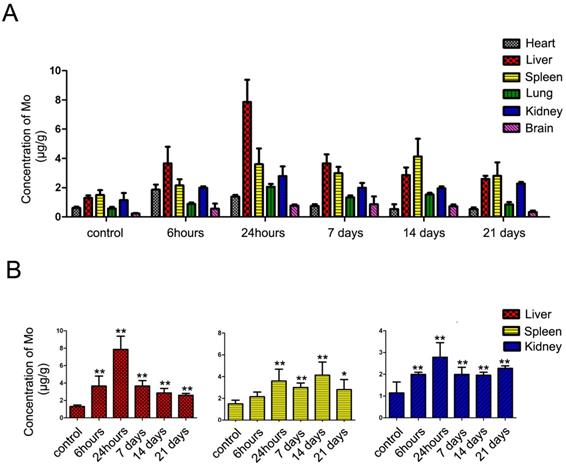
Furthermore, we measured the concentrations of molybdenum in blood and tissues by ICP-MS analysis to quantify the accumulation and biodistribution of FA/MoS2 (Figure 8 and Figure S9). The ICP-MS analysis of blood samples at 0.5 hour yielded the concentration of molybdenum in blood to be 0.678±0.062 μg mL-1. The concentration decreased with injection time, where at 6 hours, the concentration was 0.095±0.009 μg mL-1, which suggested the rapid clearance in blood of MoS2-based nanoformulations. As shown in ICP-MS analysis of tissue samples, molybdenum element has predominantly accumulated in liver, spleen and kidney. At 24 hours after subcutaneous injection, the concentrations of molybdenum in liver, spleen, and kidney were 7.87 ± 1.51 μg mL-1, 3.60 ± 1.07 μg mL-1, and 2.78 ± 0.78 μg mL-1, respectively. As time passed, the concentrations of molybdenum decreased gradually. On day 21, the concentrations of molybdenum in liver, spleen and kidney are 2.49 ± 0.33 μg mL-1, 2.35 ± 1.35 μg mL-1 and 2.23 ± 0.13 μg mL-1, respectively. Because molybdenum is one of the trace elements in organism [63], it can be detected in the tissues of untreated mice. The concentrations of molybdenum in treated mice were higher than that of untreated ones, which indicate the injected molybdenum remained in major organs for more than 21 days.
ICP-MS analysis of the major organs of treated C57BL/6 mice. In vivo biodistribution of molybdenum in Liver, Spleen, Heart, Kidney, Lung and Brain at indicated time points after subcutaneous injection with FA/MoS2 nanoparticles into C57BL/6 mice. Data are presented as the mean±SEM of triplicate experiments.*, P < 0.05, **, P < 0.01 vs PBS (as blank).
Lastly, we performed histological analysis to assess the in vivo toxicity of MoS2 nanoformulations (Figure S10). For this, hematoxylin and eosin (H&E) staining of tissue sections was done to investigate any histological changes in major organs (heart, liver, spleen, lung, kidney, and brain) 21 days post FA/MoS2 injection. We did not record any observable evidence of organ lesions in the FA/MoS2-treated mice with respect to the PBS-treated mice. Thus, the in vivo toxicity results pressingly support the use of MoS2-based nanoformulations as a low-toxic and biocompatible nanocarrier for cancer therapy.
3. Discussion and Conclusion
Pancreatic cancer stands among the most fatal cancers globally because of extensive local metastasis and advanced systemic dissemination [64]. The limitations of conventional diagnostic modalities to detect the disease in early stages has restricted the post-diagnosis average lifetime of patients to usually less than one year [65]. The traditional methods including surgery, radiation therapy, and chemotherapy can assist to prolong the lifetime of patients to some extent, but they are not suitable for long-term treatment of the disease [3]. In the last decade, a myriad of nanomaterials have been extensively applied for diagnostic and therapeutic outcomes [2, 6, 48, 49]. As representative of TMDCs, MoS2 has been widely utilized in electronics and optics [26]. Although MoS2 nanosheets possess similar properties as graphene such as large surface area, facile surface-functionalization, and good biocompatibility, there are only a handful of studies that describe the relevance MoS2 nanosheets as drug delivery systems for cancer therapy [11, 60]. Furthermore, the limited toxicity studies impede further biomedical applications of MoS2.
In this study, we explored a novel class of 2D nanomaterials-MoS2 nanosheets, and functionalized them with FA-PEG for combinatorial therapy of pancreatic cancer. We demonstrated the use of multifunctional PEG-modified MoS2 nanosheets as a multi-gene delivery system to co-deliver HDAC1 and KRAS siRNAs with photothermal effect for pancreatic cancer therapy. The cytotoxicity assessment show that the functionalized MoS2 nanosheets exhibited low cytotoxicity and were biocompatible for in vitro application. Following the successful transfection of the MoS2-based nanocarriers, fluorescence microscopy images, flow cytometry analysis, RT-PCR, and Western Blotting results validate the co-delivery of HDAC1 and KRAS siRNA molecules into Panc-1 cells with high transfection efficiency of 60% and 90%, respectively. The successful release of siRNAs inside the cells resulted in around 50% down-regulation of gene expression of both genes. The suppression of HDAC1 and KRAS gene expression essentially led to significant inhibition of cell proliferation and migration. These results underline the pressing roles of both, HDAC1 and KRAS genes, in regulating pancreatic cell proliferation, invasion, and migration, in agreement with previous reports [56, 57, 66]. Furthermore, the use of NIR light in the application of the nanocarriers was also shown to be advantageous towards the therapeutic efficacy, due to the unique optical properties of MoS2 nanosheets. In summary, our studies discover the new and promising applications of TMDCs in cancer therapy, with combinational gene and photothermal therapy, which provide new insights for the development of 2D nanomaterials for cancer theranostics.
4. Materials and methods
4.1. Chemicals and reagents
We purchased monolayer MoS2 nanosheets (62 μg mL-1, dissolved in ethanol) from 2D-Semiconductors. mPEG-NH2 (5K) and NH2-PEG-Boc (5K) from Laysan Bio, Inc (USA). We purchased Lipoic acid (LA), Folic acid (FA), trifluoroacetic acid (TFA), dichloromethane, N,N'-dicyclohexylcarbodiimide (DCC), triethylamine (TEA), sodium bicarbonate, N-Hydroxysuccinimide (NHS), dimethyl sulfoxide (DMSO), diethyl ether, Poly(allylamine hydrochloride) (PAH, molecular weight 15,000), and 3-(4,5-dimethylthiazol-2-yl)-2,5-diphenyltetrazolium bromides (MTT) from Sigma Aldrich. Antibodies against HDAC1 (ab53091), KRAS (ab55391), and Actin (ab8227) were obtained from Abcam. We used ultrapure DI water for conducting all experiments (Milli-Q Integral 5).
4.2. Synthesis of LA-PEG and LA-PEG-FA polymers
Synthesis of LA-PEG: The synthesis of mPEG-LA polymer followed a previous protocol with subtle changes [67]. Briefly, we mixed 500 mg of 5K mPEG-NH2 with 50 mg LA, 10 mg DCC and 6 μL TEA in 3 mL dichloromethane and stirred for 24 hours at room temperature. After the reaction solution got evaporated, we added 10 mL water to the solid precipitate in the bottle. The insoluble solid was removed by filtration. Sodium bicarbonate (0.1M) was added to this solution to adjust its pH to 8. Thereafter, we extracted the filtrate solution by dichloromethane for three times. When the organic solvent evaporated, the product was dissolved in water and lyophilized to obtain LA-PEG.
Synthesis of LA-PEG-FA: To synthesize LA-PEG-FA, a Boc protected bi-functional NH2-PEG-Boc polymer was used to replace mPEG-NH2. Briefly, we mixed NH2-mPEG-Boc (500 mg) with LA (50 mg), DDC (10 mg), and TEA (6 μL) in dichloromethane (3 mL) under nitrogen and kept for magnetic stirring for 24 hours at room temperature. Subsequently, the dichloromethane solvent was evaporated and then, TFA (2 mL) was added and left for magnetic stirring for 3 hours at room temperature to de-protect the Boc group. After the TFA solvent evaporated, the leftover solid was dissolved in 10 mL water. The same purification procedure was carried out to obtain the LA-PEG-NH2 mid-product in solid. FA-conjugated LA-PEG (LA-PEG-FA) was prepared by mixing the amine-functionalized LA-PEG-NH2 with activated FA. Briefly, we mixed FA (100 mg) with DCC (50 mg) and NHS (35 mg) in anhydrous DMSO (3 mL) for 15 minutes at room temperature. We then added LA-PEG-NH2 (500 mg) in DMSO (5 mL). After 24 hours stirring at room temperature, cold diethyl ether (50 mL) was added to precipitate PEG from the mixture solution. We rinsed the product with diethyl ether (5 mL) 3 times and dried in vacuum. Then, we dissolved the yellowish product in water and filtered to remove any insoluble solid. The final product, LA-PEG-FA, was lyophilized and stored at -20 °C until further use.
Synthesis of PEG or FA-PEG-coated MoS2 nanosheets: For the PEG functionalization, modified protocol was adopted from literature. In brief, 1 mg of the MoS2 solution (62 μg mL-1, ethanol) was evaporated to remove the ethanol solvent, yielding a solid, to which 10 mg of LA-PEG or LA-PEG-FA, redispersed in 2 mL of ultrapure DI water, was added. Then, we sonicated the resulting PEGylated MoS2 nanosheets mixture for 30 minutes and stirred overnight vigorously. This led to the removal of the excess unbound PEG or FA-PEG polymers upon two cycles of centrifugation at 10000 rpm for 25-30 minutes. We resuspended the precipitate and sonicated again in 1 mL of ultrapure water. This way, we obtained 1 mg mL-1 of PEGylated MoS2 nanosheets. Subsequently, we predissolved PAH in ultrapure DI water for siRNA loading, and made a 1:1 mixture of PEGylated MoS2 nanosheets (1 mg mL-1) and PAH (10 mg mL-1) in 2 mL DI water. This mixture was kept under 36 hours stirring under room temperature, followed by centrifugation to remove free PAH.
4.3. Characterizations of MoS2 nanocomplexes
The UV-visible absorption spectra of the prepared samples were recorded on a Shimadzu UV-2450 spectrophotometer with water as the reference. We measured the hydrodynamic size distribution profile and the zeta potential of the PEGylated MoS2 nanocomplex by a particle size analyzer (90 Plus, Brookhaven Instruments). We obtained the AFM images with an Asylum Research ARC2™ SPM instrument and the Fourier Transform Infrared (FTIR) spectrum by a Shimadzu FTIR spectrometer.
4.4. Gel retardation assay
We employed agarose gel electrophoresis to study the binding capacity of the synthesized PEGylated MoS2 nanocarriers with siRNA. We mixed MoS2/PEG/PAH (1 mg mL-1) with siRNA (130 μg mL-1) at five different mass ratios (0.5 μg: 1.3 μg, 1 μg: 1.3 μg, 2 μg: 1.3 μg, 4 μg: 1.3 μg and 6 μg: 1.3 μg). For electrophoresis, 1% agarose gel was mixed in TAE buffer solution at 100 V for 15 min. The intensity of ethidium bromide staining upon UV illumination was proportional to the amount of siRNA bound to the nanoplexes.
4.5. Tumor cell line and culture
The human pancreatic cancer cells, Panc-1 (CRL-1469) (American Type Culture Collection), were grown in Dulbecco's Modified Eagle's Medium (DMEM, Hyclone), supplemented with 10% fetal bovine serum (FBS, Hyclone), penicillin (Gibco, 100 μg mL-1), and streptomycin (Gibco, 100 μg mL-1). Cells were cultured and maintained in the UV incubator at 37 °C in a humidified atmosphere with 5 % CO2.
4.6. siRNA transfection
We seeded Panc-1 cells onto 6-well plates in DMEM medium with 10% FBS for 24 hours. Once the cells reached 30% - 50% confluence, they were ready for transfection. We then gently mixed the MoS2/PEG/PAH or MoS2/PEG/FA/PAH nanosheets dispersion (1 mg mL-1, 6 μL) with a G12D mutant KRAS siRNAFAM (130 μg mL-1, 10 μL) or HDAC1 siRNACyc3 and let them to rest for 30 min. Thereafter, a new culture medium with OPTI-MEM (950 μL, Invitrogen) was added to this PEGylated MoS2/siRNA mixture followed by continuous cell culturing. After four hours, we added 500 μL of DMEM + 30% FBS to the medium. In another parallel experiment, we used free siRNAFAM or siRNACyc3 at the same dose. We monitored the gene expression 72 hours post-transfection. The transfection efficiency was evaluated 4 hours post-treatment using fluorescence imaging and flow cytometry assays.
4.7. Flow Cytometry
The Panc-1 cells were trypsinized before being subjected to flow cytometry. The quantitative assessment of the siRNA transfection efficiency meditated by the synthesized MOS2 nanocarriers was done by a FACScalibur flow cytometer (Becton Dickinson, Mississauga, CA). Filter sets for KRAS siRNA (FAM) and HDAC1 siRNA (Cyc3) were used.
4.8. RNA isolation and quantitative RT-PCR
TRIzol reagent (Invitrogen) extracted the total RNA from Panc-1 cells 48 hours post transfection. The total RNA (2 μg), measured by a spectrophotometer (Nano-Drop ND-2000), was fed to a reverse transcriptase kit (Promega) to form cDNA. Evaluation of the mRNA levels of the target genes was done using an ABI Prism 7500 real-time PCR system (Applied Biosystems) by SYBR green (Promega).
4.9. Western Blotting
We seeded the cells in 6-well plates and left undisturbed for 24 hours after treating with different nanoformulations. We isolated the protein from cells by washing them with PBS and harvesting in lysis buffer. A Nano-Drop ND-2000 spectrophotometer was used to determine the total cellular protein concentration. 20 μg of denatured cellular extracts were resolved by 10% SDS-PAGE gels. The protein bands were transferred to Nitrocellulose Blotting membranes and incubated overnight at 4 °C with the appropriate primary antibody in the ratio: 1:1000 for KRAS, 1:1000 for HDAC1, and 1:1000 for actin, followed by washing in PBS buffer (0.05% Tween 20). Furthermore, they were incubated with goat anti-rabbit or anti-mouse secondary antibodies for 1 hour at room temperature. Finally, we observed proteins with chemiluminescent substrates.
4.10. Cell viability test
Following the MTT (Sigma) assay protocol, we seeded cells in a 96-well plate with 5 × 10³ cells per well and incubated with different PEGylated MoS2 nanoformulations for specified time points. Four hours post incubation, some of the groups were irradiated by an 808 nm, 1W cm-2 NIR light for 5 minutes. The cells were incubated with MTT (5 mg mL-1, 20 μL) for 4 hours at 37 °C and 5% CO2. The precipitate was solubilized on adding 150 μL DMSO (Dimethylsulfoxide, Sigma) with 5 min of gentle shaking. Then, a microplate reader (Bio-Rad) was used to record the absorbance at 490 nm. The normalized absorbance of the sample well (with respect to that of the control well) was expressed as a percentage, with the viability of non-treated cells being 100%.
4.11. Mice voluntary cage-wheel exercise
C57Bl/6 mice (female; 5 weeks old) from the Medical Laboratory Animal Center (MLAC), Guangdong Province, China were allowed an acclimatization period of 1 week at 22 ± 2 °C with a 12-hour light:dark cycle (8 am, ON: 8 pm, OFF). Then, we randomly divided C57Bl/6 into 2 groups (3-4 mice per group) and injected with PBS or FA/MoS2 (50 mg kg-1) subcutaneously. Voluntary running was performed by these two groups following the start of exercise [68]. The voluntary running system comprised of six separated chambers (Chengdu TME Technology Co., Ltd, China). During the training session, we placed the mice on a 30 mm diameter motorized rod in the chamber and gradually increased the rotation speed from 0 to 100 rpm over the course of 100s. The speed at which at the animal fell off was noted. The average rotation speed achieved by the animals in 7 trials was indicative of the performance. The two different groups were trained at the same continuous time points (day 0, day 5, day 10, day 15, and day 20). No significant changes were found between the two groups.
4.12. Preparation of paraffin sections for histological analysis
On the final day, we fixed the organ tissues in 4% buffered formalin-saline at room temperature for 24 hours. Then, we embedded the tissues in paraffin blocks and mounted 4 mm-thick paraffin sections on a glass slide for H&E staining. An Olympus BX51 microscope was used for examining the stained slices.
4.13. Inductively coupled plasma mass spectrometry (ICP-MS) analysis
FA/MoS2 (4 mg kg-1) was injected subcutaneously into 27 healthy C57BL/6 mice as the experimental groups, other three mice were injected with PBS as the control groups. Thereafter, we sacrificed three mice in each group, 0.5 hour, 1 hour, 2 hours, 4 hours, 6 hours, 24 hours, 7 days, 14 days and 21 days after injection, and collected the blood and tissue samples. Before ICP-MS analysis, a Milestone ETHOS ONE microwave acid digestion apparatus was used to digest the samples with 6 mL 65% HNO3 and 2 mL 30% H2O2 at 180 °C for 30 minutes. The sample was then diluted in 10 times DI water and the standard elemental concentrations of molybdenum were measured using an ICP-MS system (Agilent 7500C1).
4.13. PEGylated-MoS2 nanocarriers as dual, in vivo gene and photothermal therapeutic agents
All in vivo experiments were performed according to the protocol laid by the National Standard of Animal Care and Use Procedures at MLAC of Shenzhen University, Guangdong Province, China (Permit number: SZU-HC-2014-02). Following a 1-week acclimatization, we maintained the mice in an isolated biosafety facility meant for specific pathogen free (SPF) animals with bedding, food, and water. For tumor suppression assay, we inoculated athymic 6-weeks old nude mice with in vitro propagated Panc-1 cells (1 x 10⁷) subcutaneously in the lower flank of mice. As the tumor grew in 10-15 days, we randomly divided the tumor-bearing mice (tumor size > 100-150 mm3) into 6 groups of 3-4 mice per treatment group and subcutaneously injected each group with different PEGylated MoS2 nanoformulations, summarized in Table 1. The injections were performed on every fourth day, starting on day 0. We used calipers (accuracy = 0.02 mm) to measure tumor volumes every other day, according to the expression V = L×W2/2 (W, the shortest dimension; L, the longest dimension). Change in size of each tumor was estimated relative to the corresponding size at day 0. We used one-way analysis of variance to test the statistical significances between groups.
Different nanoformulations for in vivo gene and photothermal therapy
| Group Number | Nanoformulations |
|---|---|
| 1 | no treatment (PBS) |
| 2 | FA/MoS2 (4 mg kg-1, injection) |
| 3 | FA/MoS2 (4 mg kg-1, injection) with NIR light |
| 4 | FA/MoS2/scramble siRNA (FA/MoS2 4 mg kg-1, siRNA 16 μg, injection) |
| 5 | FA/MoS2/siRNA(HDAC1+KRAS) (FA/MoS2 4 mg kg-1, siRNA 16 μg, injection) |
| 6 | FA/MoS2/siRNA(HDAC1+KRAS) (FA/MoS2 4 mg kg-1, siRNA 16 μg, injection) with NIR light |
Abbreviations
DNA, Deoxyribonucleic acid; Transition metal dichalcogenides, TMDCs; two-dimensional, 2D; small interfering RNAs, siRNAs; Near Infrared, NIR; Histone Deacetylase 1, HDAC1; gold nanorods, AuNRs; molybdenum disulfide, MoS2; folic acid, FA; Polyethyleneglycol, PEG; polyallylamine hydrochloride, PAH; PBS, Phosphate-buffered saline; lipoic acid, LA; dynamic light scattering, DLS; atomic force microscope, AFM; Inductively coupled plasma mass spectrometry, ICP-MS; hematoxylin and eosin, H&E.
Acknowledgements
The authors would like to thank Prof. Yining Lin of Key Laboratory of Optoelectronic Devices and Systems of Ministry of Education and Guangdong Province, Shenzhen University for her contribution in data analysis. The authors acknowledge the support of the Ministry of Education, Singapore (Tier 2 MOE2010-T2-2-010), A*STAR Science and Engineering Research Council, NTU-A*STAR Silicon Technologies, Centre of Excellence program grant, NTU-NHG Innovation Collaboration Grant, NEWRI Seed Grant, and the School of Electrical and Electronic Engineering at Nanyang Technological University, Singapore.
Supplementary Material
Supplementary figures.
Competing Interests
The authors have declared that no competing interest exists.
References
1. Gallo J, Long NJ, Aboagye EO. Magnetic nanoparticles as contrast agents in the diagnosis and treatment of cancer. Chem Soc Rev. 2013;42:7816-33
2. Fernandez-Fernandez A, Manchanda R, McGoron AJ. Theranostic applications of nanomaterials in cancer: drug delivery, image-guided therapy, and multifunctional platforms. Appl Biochem Biotechnol. 2011;165:1628-51
3. Yin F, Yang C, Wang Q, Zeng S, Hu R, Lin G. et al. A Light-Driven Therapy of Pancreatic Adenocarcinoma Using Gold Nanorods-Based Nanocarriers for Co-Delivery of Doxorubicin and siRNA. Theranostics. 2015;5:818-33
4. Cha C, Shin SR, Annabi N, Dokmeci MR, Khademhosseini A. Carbon-based nanomaterials: multifunctional materials for biomedical engineering. ACS Nano. 2013;7:2891-7
5. Salata O. Applications of nanoparticles in biology and medicine. J Nanobiotechnology. 2004;2:3
6. Schwendener RA. Liposomes in biology and medicine. Adv Exp Med Biol. 2007;620:117-28
7. Anderson T, Hu R, Yang C, Yoon HS, Yong K-T. Pancreatic cancer gene therapy using an siRNA-functionalized single walled carbon nanotubes (SWNTs) nanoplex. Biomater Sci. 2014;2:1244-53
8. Tarn D, Ashley CE, Xue M, Carnes EC, Zink JI, Brinker CJ. Mesoporous silica nanoparticle nanocarriers: biofunctionality and biocompatibility. Acc Chem Res. 2013;46:792-801
9. Mazumder S, Dey R, Mitra MK, Mukherjee S, Das GC. Review: Biofunctionalized Quantum Dots in Biology and Medicine. J Nanomater. 2009
10. Zhang B, Wang Y, Hu R, Roy I, Yong K-T. Cadmium-Free Quantum Dots for Biophotonic Imaging and Sensing. In: (ed.) Ho AHP, Kim D, Somekh MG. Handbook of Photonics for Biomedical Engineering. Dordrecht: Springer Netherlands. 2014 p. 1-27
11. Liu T, Wang C, Gu X, Gong H, Cheng L, Shi X. et al. Drug Delivery with PEGylated MoS2 Nano-sheets for Combined Photothermal and Chemotherapy of Cancer. Adv Mater. 2014;26:3433-40
12. Rosenblum D, Joshi N, Tao W, Karp JM, Peer D. Progress and challenges towards targeted delivery of cancer therapeutics. Nat Commun. 2018;9:1410
13. Zhu X, Ji X, Kong N, Chen Y, Mahmoudi M, Xu X. et al. Intracellular Mechanistic Understanding of 2D MoS2 Nanosheets for Anti-Exocytosis-Enhanced Synergistic Cancer Therapy. ACS Nano. 2018;12:2922-38
14. Tao W, Zhu X, Yu X, Zeng X, Xiao Q, Zhang X. et al. Black Phosphorus Nanosheets as a Robust Delivery Platform for Cancer Theranostics. Adv Mater. 2016;29:1603276
15. Tao W, Ji X, Xu X, Islam Mohammad A, Li Z, Chen S. et al. Antimonene Quantum Dots: Synthesis and Application as Near-Infrared Photothermal Agents for Effective Cancer Therapy. Angew Chem Int Ed Engl. 2017;56:11896-900
16. Ding L, Zhu X, Wang Y, Shi B, Ling X, Chen H. et al. Intracellular Fate of Nanoparticles with Polydopamine Surface Engineering and a Novel Strategy for Exocytosis-Inhibiting, Lysosome Impairment-Based Cancer Therapy. Nano Lett. 2017;17:6790-801
17. Tao W, Zeng X, Wu J, Zhu X, Yu X, Zhang X. et al. Polydopamine-based surface modification of novel nanoparticle-aptamer bioconjugates for in vivo breast cancer targeting and enhanced therapeutic effects. Theranostics. 2016;6:470
18. Novoselov KS, Geim AK, Morozov SV, Jiang D, Zhang Y, Dubonos SV. et al. Electric Field Effect in Atomically Thin Carbon Films. Science. 2004;306:666-9
19. Wang X, Zhi L, Mullen K. Transparent, conductive graphene electrodes for dye-sensitized solar cells. Nano Lett. 2008;8:323-7
20. Shao YY, Wang J, Wu H, Liu J, Aksay IA, Lin YH. Graphene Based Electrochemical Sensors and Biosensors: A Review. Electroanalysis. 2010;22:1027-36
21. Wei ZQ, Wang DB, Kim S, Kim SY, Hu YK, Yakes MK. et al. Nanoscale Tunable Reduction of Graphene Oxide for Graphene Electronics. Science. 2010;328:1373-6
22. Raccichini R, Varzi A, Passerini S, Scrosati B. The role of graphene for electrochemical energy storage. Nat Mater. 2015;14:271-9
23. Sun XM, Liu Z, Welsher K, Robinson JT, Goodwin A, Zaric S. et al. Nano-Graphene Oxide for Cellular Imaging and Drug Delivery. Nano Res. 2008;1:203-12
24. Yang K, Zhang S, Zhang G, Sun X, Lee ST, Liu Z. Graphene in mice: ultrahigh in vivo tumor uptake and efficient photothermal therapy. Nano Lett. 2010;10:3318-23
25. Jariwala D, Sangwan VK, Lauhon LJ, Marks TJ, Hersam MC. Emerging device applications for semiconducting two-dimensional transition metal dichalcogenides. ACS Nano. 2014;8:1102-20
26. Wang QH, Kalantar-Zadeh K, Kis A, Coleman JN, Strano MS. Electronics and optoelectronics of two-dimensional transition metal dichalcogenides. Nat Nanotechnol. 2012;7:699-712
27. Chng ELK, Sofer Z, Pumera M. MoS2 exhibits stronger toxicity with increased exfoliation. Nanoscale. 2014;6:14412-8
28. Zhu C, Zeng Z, Li H, Li F, Fan C, Zhang H. Single-Layer MoS2-Based Nanoprobes for Homogeneous Detection of Biomolecules. J Am Chem Soc. 2013;135:5998-6001
29. Kong L, Xing L, Zhou B, Du L, Shi X. Dendrimer-Modified MoS2 Nanoflakes as a Platform for Combinational Gene Silencing and Photothermal Therapy of Tumors. ACS Appl Mater Interfaces. 2017;9:15995-6005
30. Wang C, Bai J, Liu Y, Jia X, Jiang X. Polydopamine Coated Selenide Molybdenum: A New Photothermal Nanocarrier for Highly Effective Chemo-Photothermal Synergistic Therapy. ACS Biomater Sci Eng. 2016;2:2011-7
31. Yuwen L, Zhou J, Zhang Y, Zhang Q, Shan J, Luo Z. et al. Aqueous phase preparation of ultrasmall MoSe2 nanodots for efficient photothermal therapy of cancer cells. Nanoscale. 2016;8:2720-6
32. Wang J, Tan X, Pang X, Liu L, Tan F, Li N. MoS2 Quantum Dot@Polyaniline Inorganic-Organic Nanohybrids for in Vivo Dual-Modal Imaging Guided Synergistic Photothermal/Radiation Therapy. ACS Appl Mater Interfaces. 2016;8:24331-8
33. Wivel NA, Wilson JM. Methods of gene delivery. Hematol Oncol Clin North Am. 1998;12:483-501
34. Lehman IR. DNA ligase: structure, mechanism, and function. Science. 1974;186:790-7
35. Clark AJ. Recombination deficient mutants of E. coli and other bacteria. Annu Rev Genet. 1973;7:67-86
36. El-Aneed A. An overview of current delivery systems in cancer gene therapy. J Control Release. 2004;94:1-14
37. Hacein-Bey-Abina S, Hauer J, Lim A, Picard C, Wang GP, Berry CC. et al. Efficacy of gene therapy for X-linked severe combined immunodeficiency. N Engl J Med. 2010;363:355-64
38. Kojima H, Fujimiya M, Matsumura K, Younan P, Imaeda H, Maeda M. et al. NeuroD-betacellulin gene therapy induces islet neogenesis in the liver and reverses diabetes in mice. Nat Med. 2003;9:596-603
39. Yla-Herttuala S, Martin JF. Cardiovascular gene therapy. Lancet. 2000;355:213-22
40. Buckingham SD, Esmaeili B, Wood M, Sattelle DB. RNA interference: from model organisms towards therapy for neural and neuromuscular disorders. Hum Mol Genet. 2004:13 Spec No 2: R275-88
41. Aagaard L, Rossi JJ. RNAi therapeutics: principles, prospects and challenges. Adv Drug Deliv Rev. 2007;59:75-86
42. Sharp PA. RNAi and double-strand RNA. Genes Dev. 1999;13:139-41
43. Elbashir SM, Harborth J, Lendeckel W, Yalcin A, Weber K, Tuschl T. Duplexes of 21-nucleotide RNAs mediate RNA interference in cultured mammalian cells. Nature. 2001;411:494-8
44. Zou GM, Wu W, Chen J, Rowley JD. Duplexes of 21-nucleotide RNAs mediate RNA interference in differentiated mouse ES cells. Biol Cell. 2003;95:365-71
45. Whitehead KA, Langer R, Anderson DG. Knocking down barriers: advances in siRNA delivery. Nat Rev Drug Discov. 2009;8:129-38
46. Shim MS, Kwon YJ. Efficient and targeted delivery of siRNA in vivo. FEBS J. 2010;277:4814-27
47. Buyens K, De Smedt SC, Braeckmans K, Demeester J, Peeters L, van Grunsven LA. et al. Liposome based systems for systemic siRNA delivery: stability in blood sets the requirements for optimal carrier design. J Control Release. 2012;158:362-70
48. Zhao E, Zhao Z, Wang J, Yang C, Chen C, Gao L. et al. Surface engineering of gold nanoparticles for in vitro siRNA delivery. Nanoscale. 2012;4:5102-9
49. Meng H, Mai WX, Zhang HY, Xue M, Xia T, Lin SJ. et al. Codelivery of an Optimal Drug/siRNA Combination Using Mesoporous Silica Nanoparticles To Overcome Drug Resistance in Breast Cancer in Vitro and in Vivo. ACS Nano. 2013;7:994-1005
50. Chou SS, Kaehr B, Kim J, Foley BM, De M, Hopkins PE. et al. Chemically Exfoliated MoS2 as Near-Infrared Photothermal Agents. Angew Chem Int Ed Engl. 2013;52:4160-4
51. Teo WZ, Chng ELK, Sofer Z, Pumera M. Cytotoxicity of Exfoliated Transition-Metal Dichalcogenides (MoS2, WS2, and WSe2) is Lower Than That of Graphene and its Analogues. Chemistry. 2014;20:9627-32
52. Yin F, Lan RF, Zhang XM, Zhu LY, Chen FF, Xu ZS. et al. LSD1 Regulates Pluripotency of Embryonic Stem/Carcinoma Cells through Histone Deacetylase 1-Mediated Deacetylation of Histone H4 at Lysine 16. Mol Cell Biol. 2014;34:158-79
53. Kuzmochka C, Abdou HS, Hache RJG, Atlas E. Inactivation of Histone Deacetylase 1 (HDAC1) But Not HDAC2 Is Required for the Glucocorticoid-Dependent CCAAT/Enhancer-Binding Protein alpha (C/EBP alpha) Expression and Preadipocyte Differentiation. Endocrinology. 2014;155:4762-73
54. Glozak MA, Seto E. Histone deacetylases and cancer. Oncogene. 2007;26:5420-32
55. Xie HJ, Noh JH, Kim JK, Jung KH, Eun JW, Bae HJ. et al. HDAC1 inactivation induces mitotic defect and caspase-independent autophagic cell death in liver cancer. PLoS One. 2012;7:e34265
56. Wang S, Yan-Neale Y, Fischer D, Zeremski M, Cai R, Zhu J. et al. Histone deacetylase 1 represses the small GTPase RhoB expression in human nonsmall lung carcinoma cell line. Oncogene. 2003;22:6204-13
57. Delarue FL, Adnane J, Joshi B, Blaskovich MA, Wang DA, Hawker J. et al. Farnesyltransferase and geranylgeranyltransferase I inhibitors upregulate RhoB expression by HDAC1 dissociation, HAT association and histone acetylation of the RhoB promoter. Oncogene. 2007;26:633-40
58. Lin GM, Hu R, Law WC, Chen CK, Wang YC, Chin HL. et al. Biodegradable Nanocapsules as siRNA Carriers for Mutant K-Ras Gene Silencing of Human Pancreatic Carcinoma Cells. Small. 2013;9:2757-63
59. Adjei AA. Blocking oncogenic Ras signaling for cancer therapy. J Natl Cancer Inst. 2001;93:1062-74
60. Kim J, Kim H, Kim WJ. Single-Layered MoS2-PEI-PEG Nanocomposite-Mediated Gene Delivery Controlled by Photo and Redox Stimuli. Small. 2016;12:1184-92
61. Riahi R, Yang Y, Zhang DD, Wong PK. Advances in wound-healing assays for probing collective cell migration. J Lab Autom. 2012;17:59-65
62. Rodriguez LG, Wu X, Guan JL. Wound-healing assay. Methods Mol Biol. 2005;294:23-9
63. Fraga CG. Relevance, essentiality and toxicity of trace elements in human health. Mol Aspects Med. 2005;26:235-44
64. Keleg S, Buchler P, Ludwig R, Buchler MW, Friess H. Invasion and metastasis in pancreatic cancer. Mol Cancer. 2003;2:14
65. Vincent A, Herman J, Schulick R, Hruban RH, Goggins M. Pancreatic cancer. Lancet. 2011;378:607-20
66. Jiang K, Sun J, Cheng J, Djeu JY, Wei S, Sebti S. Akt mediates Ras downregulation of RhoB, a suppressor of transformation, invasion, and metastasis. Mol Cell Biol. 2004;24:5565-76
67. Cheng L, Yang K, Li Y, Chen J, Wang C, Shao M. et al. Facile Preparation of Multifunctional Upconversion Nanoprobes for Multimodal Imaging and Dual-Targeted Photothermal Therapy. Angew Chem Int Ed Engl. 2011;50:7385-90
68. Yang G, Lai CS, Cichon J, Ma L, Li W, Gan WB. Sleep promotes branch-specific formation of dendritic spines after learning. Science. 2014;344:1173-8
Author contact
![]() Corresponding author: ktyongedu.sg
Corresponding author: ktyongedu.sg