- Volume 10; 2026
- Volume 9; 2025
- Volume 8; 2024
- Volume 7; 2023
- Volume 6; 2022
- Archive
- Editorial Board
- Cover Suggestion
- Index & Coverage
- Special Issues
Introduction
Materials and Methods
Results
Discussion
Conclusion
Acknowledgements
Supplementary Material
References
International Journal of Biological Sciences
International Journal of Medical Sciences

 Global reach, higher impact
Nanotheranostics 2019; 3(2):179-195. doi:10.7150/ntno.31878 This issue Cite
Research Paper
Various Nucleolar Stress Inducers Result in Highly Distinct Changes in Water, Dry Mass and Elemental Content in Cancerous Cell Compartments: Investigation Using a Nano-Analytical Approach
Jean Michel1, Frédérique Nolin2, Laurence Wortham3, Nathalie Lalun1, Pavel Tchelidze4, Vincent Banchet1, Christine Terryn3, Dominique Ploton5 ![]()
1. UMR-S 1250 INSERM, Université de Reims Champagne Ardenne
2. Université de Reims Champagne Ardenne
3. Platform of Cell and Tissue Imaging (PICT), Université de Reims Champagne Ardenne
4. Faculty of Exact and Life Sciences, Department of Morphology, Tbilisi State University, Tbilisi, Georgia
5. BioSpecT, EA 7506, Université de Reims Champagne Ardenne
Received 2018-11-29; Accepted 2019-4-20; Published 2019-5-3
Abstract

Rationale: Numerous chemotherapeutic drugs that affect ribosome biogenesis in the nucleolus induce nucleolar stress. Improving our understanding of the effects of these drugs will require uncovering and comparing their impact on several biophysical parameters of the major cell compartments. Here, we quantified the water content and dry mass of cancerous cells treated with CX-5461, DRB or DAM to calculate macromolecular crowding and the volume occupied by free water, as well as elemental content.
Methods: HeLa-H2B-GFP cells were treated with CX-5461, DRB or DAM. Water content and dry mass were measured in numerous regions of interest of ultrathin cryo-sections by quantitative scanning transmission electron microscope dark-field imaging and the elements quantified by energy dispersive X-ray spectrometry. The data were used to calculate macromolecular crowding and the volume occupied by free water in all cell compartments of control and treated cells. Hydrophobic and unfolded proteins were revealed by 8-Anilinonaphtalene-1-sulfonic acid (ANS) staining and imaging by two-photon microscopy. Immunolabeling of UBF, pNBS1 and pNF-κB was carried out and the images acquired with a confocal microscope for 3D imaging to address whether the localization of these proteins changes in treated cells.
Results: Treatment with CX-5461, DRB or DAM induced completely different changes in macromolecular crowding and elemental content. Macromolecular crowding and elemental content were much higher in CX-5461-treated, moderately higher in DRB-treated, and much lower in DAM-treated cells than control cells. None of the drugs alone induced nucleolar ANS staining but it was induced by heat-shock of control cells and cells previously treated with DAM. UBF and pNBS1 were systematically co-localized in the nucleolus of CX-5461- and DAM-treated cells. pNF-κB only localized to the nucleolar caps of pre-apoptotic DAM-treated cells.
Conclusion: We directly quantified water and ion content in cell compartments using cryo-correlative electron microscopy. We show that different chemotherapeutic nucleolar stress inducers result in distinctive, thus far-unrecognized changes in macromolecular crowding and elemental content which are known to modify cell metabolism. Moreover we were able to correlate these changes to the sensitivity of treated cells to heat-shock and the behavior of nucleolar pNBS1 and pNF-κB.
Keywords: nucleolar stress inducers, water and elemental content, macromolecular crowding, NBS1, and NF-κB.
Introduction
Numerous stresses that affect cellular homeostasis induce the downregulation of ribosomal RNA (rRNA) synthesis and ribosome biogenesis. These processes take place in the nucleolus which is now recognized to be a highly efficient stress sensor [1, 2, 3]. The activation of nucleolar pathways during nucleolar stress [4, 5] induces p53-dependant and p53-independent responses [6, 7], leading to cell-cycle arrest, senescence, and apoptosis [8, 9]. Many chemotherapeutic drugs are known to affect ribosome biogenesis at different levels [10]. Research is actively ongoing in this field to develop new drugs that affect specific steps of rRNA synthesis [8, 11, 12]. Overall, these studies highlight the complexity and interconnectedness of numerous molecular pathways, which are activated or inhibited during the action of classical and new chemotherapeutic drugs [12, 13].
One way to increase our knowledge concerning the effects of chemotherapeutic drugs may be to study how these drugs affect the biophysical properties of treated cells. Physical and chemical stresses induce changes in cellular biophysical parameters, such as their volume, dry mass content, density, viscoelasticity, and stiffness [14]. For example, it was recently demonstrated that changes in the rate of mass accumulation were predictive of single-cell responses to drugs [15]. Changes in biophysical parameters frequently correlate with water influx or efflux, as well as changes in macromolecular crowding (MC) [16, 17, 18] which are known to affect biochemical reactions [19, 20, 21] and various cellular processes [for a review see 22].
We previously developed an original imaging and analytical method to investigate whether drugs that interfere with rRNA synthesis induce changes in the water, dry mass, and ion content of various organelles of cancerous cells [23]. It consists of correlative light and cryo-scanning transmission electron microscopy imaging to simultaneously quantify water, dry mass, and elemental content (measured in mmol/L) of specific targeted nano-regions of nuclear and cytoplasm sub-compartments. We previously used this approach to show that the stress provoked by a low dose of DAM (50 ng/mL) induced a strong increase in water content in all cell compartments and a decrease in the quantity of all elements relative to control cells [24]. A high dose of DAM (500 ng/mL), which induced apoptosis, also provoked an increase in water content and strong variations of ion content in all cellular compartments during all steps of apoptosis, specific to each organelle and step of apoptosis [25].
DAM is an intercalating agent that inhibits Pol I progression [26]. Here, we investigated whether various rRNA synthesis inhibitors induce the same changes in water, dry mass, and ion content. We tested two drugs with completely different effects on rRNA synthesis. The first was the new drug CX-5461, which selectively inhibits Pol 1 transcription by inhibiting formation of the SL-1 preinitiation complex at the rDNA promotor [11, 27] and is also a G-quadruplex (G4) DNA motif binder (28); the second was the kinase inhibitor DRB which inhibits mRNA synthesis and the early processing of rRNA [8, 10, 26]. We determined the water and dry mass content to calculate, for the first time, MC in various cell compartments to better compare the effects of these highly different drugs. The three inhibitors, CX-5461, DRB, and DAM, induced completely different changes in MC and ion content in different organelles. In addition, these results appear to correlate with the varying sensitivity of the treated cells to nucleolar heat-shock and different localization of NBS1 and NF-kB proteins.
Materials and Methods
Cell culture
HeLa cells stably expressing H2B-GFP (kindly provided by K. Monier, University of Lyon, France) were cultured in DMEM (Gibco) supplemented with 10% fetal bovine serum in 25cm2 Nunc flasks, with passaging twice weekly (at confluence). All cultures tested negative for mycoplasma infection.
Treatment of cells with CX-5461, DRB or DAM
HeLa-H2B-GFP cells were treated with: 1) 2 µM CX-5461 for 30 h to induce senescence, 2) 60 µM 5-6 dichloro-1-b-D-ribofuranosyl benzimidazole (DRB) for 6 h, or 3) 40 nM D-actinomycin (DAM) for 4 h to induce stress or 400 nM DAM for 7 h to induce pre-apoptosis and apoptosis (25).
β-galactosidase-based senescence detection assay
The induction of senescence in cells treated with 2 µM CX-5461 for 30 h was analyzed using the Senescence β-galactosidase kit (Cell signaling), according to the manufacturer's instructions.
Targeted nano-analysis of water and ions in cell compartments by cryo-correlative electron microscopy
We used the same approach as previously published by our group [See 23 and 29 for detailed methodology). Briefly, living H2B-GFP cells (control or treated cells) were directly plunged in liquid ethane cooled by liquid nitrogen (Gatan cryoplunge CP3). Ultrathin cryo-sections, 85 nm nominal thickness, were cut (Leica EM FC/UC6) and collected on a formvar-carbon-coated indexed grid to facilitate the precise localization of regions of interest (ROI) for successive light and electron microscope imaging. The grid was then placed in the electron microscope cryo-holder (Gatan model 666). The cryo-holder was first placed in a home-made designed dewar placed on the stage of an epifluorescence microscope (Zeiss Scope A1) to maintain it at -170°C. This original methodology [23] allows the successive imaging of grids in light and electron microscopes without manipulating them between the two imaging modes. This is important due to the extreme fragility of the cryosections. Nuclear fluorescence, due to H2B-GFP, revealed the presence of condensed chromatin (highest intensity), uncondensed chromatin (faint fluorescence), and nucleoli or nucleoplasm (no fluorescence). For each cryo-section, many cells were identified, accurately localized relative to grid indices, and images systematically recorded. The cryo-holder was then transferred directly to a scanning transmission electron microscope (STEM JEOL 2100F) and the ultrathin section freeze-dried under the vacuum condition of the microscope, by slowly warming it up to -80°C and re-cooling to -170°C, and observed. Freeze-drying is important as it increases the contrast and reduces the electron irradiation sensitivity of the cryosections relative to direct observation of frozen-hydrated cryosections. We previously showed that, under our experimental conditions, freeze-drying results in homogeneous lateral shrinkage of the cryosections of approximately 10 % [30]. This so called cryomethod allows the measurement of ion and water content at subcellular resolution (a few tens of nanometers) in a close to native state, in contrast to classical methods, performed at room temperature, which induce the loss of water and diffusible ions. Each cell, previously identified by the fluorescence of its chromatin and its position relative to the grid indices, was easily found by electron microscopy. Different ROIs were identified in each cell by comparing the fluorescence image and electron microscopy image side by side (or by merging) [23, 24]. Thus, high fluorescence intensity identified condensed chromatin, whereas its absence identified either nucleolar compartments (dense and granular components, nucleolar fibrillar centers), easily visualized by electron microscopy or nucleoplasm (outside the fluorescent chromatin). Electron microscopy imaging of the cytoplasm visualized mitochondria (containing cristae) and cytosol without organelles. Finally, water and dry mass contents were measured in each ROI by quantitative STEM dark-field imaging and the elements quantified by energy dispersive X-ray spectrometry (EDXS) using the Cliff-Lorimer quantification method.
Calculation of macromolecular crowding (% of volume occupied with hydrated matter (HM))
The hydration of macromolecules represents approximately 0.5 g of water per g of dry matter [19].
As the mass of hydrated matter (mHM) equals the mass of dry matter (mDM) plus hydration water, which is half of mDM, we can write (in grams):
mHM = 1.5 x mDM
To calculate MC, we used our data obtained for mitochondria. Using our methodology [23], we were able to measure that the percentage of dry mass DM (%) in the mitochondria of control HeLa cells expressing H2B-GFP was 41%. Thus, the mass percentage of hydrated matter in mitochondria was:
HM (%) = 1.5 x DM(%) = 1.5 x 41 = 61.5% and, consequently, the mass percentage of free water (FW) was FW(%) = 100 - 61.5 = 38.5 %.
The density of mitochondria is approximately 1.20 g/ml [31]. We can thus calculate that the mass of hydrated matter in 1.20 g or 1 ml of mitochondria is:
mHM = 0.615 x 1.2 = 0.738 g and that the mass of FW is mFW = 0.385 x 1.2 = 0.462 g.
Thus, we obtain the following equation for volumes:
where ρFW and ρHM correspond to the density of water and of hydrated matter in the mitochondria, respectively. We can then calculate that in mitochondria ρHM = 1.371 g/ml.
Assuming that the density of hydrated matter calculated for mitochondria is a good approximation for hydrated matter in all cell compartments of both control and treated cells, we used this data to calculate MC, defined by:
We can then express the previous equation using our experimental measurement by quantitative STEM of the percentage of dry mass DM (%) for any region of interest (ROI) of mass M:
We used this formula to calculate MC in all cell compartments of control and treated cells.
Measurement of mitochondrial diameter
The diameter of mitochondria (i.e. the length of the small axis parallel to cristae) was measured on images of ultrathin cryo-sections of control cells and of cells treated with CX, DRB or DAM by using Image J software (Rasband, W.S., ImageJ, U. S. National Institutes of Health, Bethesda, Maryland, USA, https://imagej.nih.gov/ij/, 1997-2018). In each condition, 324 to 487 mitochondria were measured. P values, compared to control, were calculated using a two-tailed Student's-test unpaired with equal variance.
Heat shock
HeLa cells stably expressing H2B-GFP, seeded on 21-mm uncoated glass-bottomed “Ibidi µ-Dish-500” Petri dishes (Ibidi GmbH, Germany), were transferred to 42°C for 2.5 h before staining with ANS for 30 min at 42°C.
ANS (8-Anilinonaphtalene-1-sulfonic acid) staining to show hydrophobic pockets of proteins and unfolded proteins
ANS, at a final concentration of 200 µM, was added to living cells seeded on 21-mm uncoated glass-bottomed “Ibidi µ-Dish-500” Petri dishes (Ibidi GmbH, Germany) cultured in DMEM without fetal bovine serum and incubated for at least 30 min. Dishes were immediately placed on the stage of an LSM 710-NLO laser scanning confocal microscope (Zeiss Microsystems, Gennevilliers, France), enclosed in an XL-5 dark LS 2000 incubator (PeCon, Germany), maintained at 37°C with a heating unit and temperature controller. Two-photon excitation at 750 nm [32], with a CHAMELEON femtosecond titanium-saphire laser (Coherent, Santa Clara, CA) at a power of 1.5%, was used to simultaneously elicit GFP (H2B-GFP) and ANS fluorescence at 510 nm and 475 nm, respectively.
Immunolabeling of UBF, pNBS1, and pNF-κB
Immunolabeling was carried out on HeLa cells stably expressing histone H2B tagged with GFP (H2B-GFP) seeded onto coverslips under control conditions, and those treated with 2 µM CX-5461 (Merck Chimie SAS, Fontenay sous Bois, France) for 30 h to induce senescence, 60 µM DRB (Sigma, Saint Quentin Fallavier, France) for 6 h, or 50 ng/mL DAM (Sigma, Saint Quentin Fallavier, France) for 3 h or 500 ng/mL DAM for 7 h. Cells were simultaneously fixed and permeabilized with 4% paraformaldehyde and 0.1% Triton-X100 (Sigma, Saint Quentin Fallavier, France) for 5 min at room temperature. Non-specific binding sites were saturated by incubation for 30 min with 10% normal goat serum (for UBF and fibrillarin immunostaining) or overnight with 3% BSA (for pNBS1 and pNF-kB immunostaining). Cells were immunolabelled by incubation for 30 min at room temperature with mouse monoclonal anti-UBF diluted 1:200 (Santa Cruz Biotechnology, Tebu-Bio, Le Perray en Yvelines, France), rabbit monoclonal anti-phospho NBS1 diluted 1:200 (Abcam, Paris, France), rabbit monoclonal anti phospho NF-kB p65 (Ser 536) diluted 1:20 (Invitrogen,).
Depending on the primary antibody used, the cells were then incubated with biotinylated (1:50) (Jackson, Interchim, Montluçon, France), or Alexa Fluor 568-coupled (1:100) (Molecular Probes, Life Technologies, Saint Aubin, France), or Dylight 633-coupled secondary antibodies (ThermoFischer Scientific, Courtaboeuf, France) for 30 min. When needed, streptavidin-Alexa-Fluor 568 (1:1000) or streptavidin-Alexa 634 (1:500) (Molecular Probes, Life Technologies, Saint Aubin, France) were added and the mixture was incubated for 30 minutes or 1 h. Coverslips were mounted in Citifluor.
Confocal imaging
Z-stacks of 40 to 60 optical sections, with 512 x 512 pixels and 2 16 gray levels, were acquired with an LSM 710 confocal microscope (Zeiss Microsystems, Gennevilliers, France) equipped with a 63x Plan-apochromat 1.4 NA oil objective (Zeiss Microsystems, Gennevilliers, France). ANS, GFP, Alexa 568, Alexa 634 and Dylight 633 were excited either sequentially or simultaneously with different laser lines: 750 nm (two-photon), 488 nm (argon laser), 561 nm (laser diode), and 633 nm (HeNe laser). Differential interference contrast (DIC) imaging was simultaneously performed with a specific detector for transmitted light to visualize organelles in the cytoplasm (mitochondria, vesicles) or chromatin clumps and nucleoli in the nuclei. Each z-stack was then processed using Amira® 6.1 (FEI, Mérignac, France) to obtain a surface or volume rendering image for one, two or three fluorescent markers.
Results
Overview of our cryo-correlative nano-imaging approach
Our electron microscopy approach allowed us to: i) quantify dry mass and water content in each pixel of the image by dark-field imaging and ii) identify and quantify elements (N, P, K, Na, Cl, S, and Mg) by energy dispersive X-ray spectrometry (EDXS) in nano-ROIs within the compartments of control and treated cells. These compartments were located in: i) the nucleus: condensed chromatin, nucleolar compartments (dense fibrillary component (DFC), granular component (GC) and fibrillar centers (FC)) and nucleoplasm and ii) the cytoplasm: cytosol without organelles and mitochondria (containing cristae).
From quantification of dry mass and water content to the quantification of molecular crowding in control cells
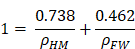
We first quantified the dry mass and water content in several ROI of a large number of control cells (n= 194). We did not synchronize the cells, and thus analyzed the cells in different phases of the cell-cycle. We therefore pooled all the data obtained for each cell compartment and present only mean values. For each compartment, we present the percentage of dry mass and water content and their ratio (Figure 1A). These data confirmed our previous findings [24]. In the nucleus, the highest dry mass content was found in condensed chromatin and nucleolar DFC and GC (approximately 40 and 30%, respectively) whereas the lowest content was found in nucleolar FC and nucleoplasm (approximately 15 and 20%, respectively). In the cytoplasm, the dry mass content in mitochondria (41%) was two-fold higher than that of cytosol. The percentage of dry mass content relative to that of water was much higher in condensed chromatin (60%) than in nucleolar DFC and GC (40%), nucleolar FC (20%), and nucleoplasm (30%). In the cytoplasm, this percentage was more than two-fold higher in mitochondria than in cytosol (70 and 30%, respectively).
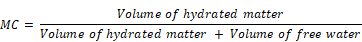
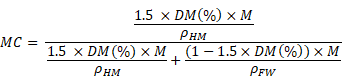
A) Quantification of the percentage of dry mass (DM) and water content (W) by dark-field cryo-electron microscopy imaging of the main compartments of control cells. For each compartment, data were pooled and the means and their ratio (DM/W) are shown (n = 194 cells). B) Mean percentage of the volume occupied by hydrated macromolecules (i.e. macromolecular crowding) and free water in the main compartments of control cells (n = 194 cells). C) Mean of the percentage of macromolecular crowding in the main compartments of control cells (Ctrl; n = 194 cells) and cells treated with CX-5461 for 30 h (n = 61 cells), DRB for 6 h (n = 62 cells), and DAM (low and high concentration) during 4 and 7 h, respectively (n = 39 non apoptotic cells). Condensed chromatin (cond.chr.), nucleolar dense component (DFC), nucleolar granular component (GC), nucleolar fibrillar centers (FC), nucleoplasm (nucleopl.), cytosol, and mitochondria (mitoch.). Data are the means of three separate experiments +/- 1 standard deviation.
We then analyzed these data differently. We reasoned that the water content of a ROI is distributed between free water, FW, and the water used to hydrate the macromolecules (see materials and methods for details). Hence, we were able to calculate the percentage of the volume occupied by hydrated macromolecules, MC, and that occupied by FW molecules in each ROI of control Hela cells (Figure 1B). We calculated that MC reached: i) approximately 50%, 40%, 20 % and 30% in the nucleus for condensed chromatin, nucleolar DFC and GC, FC and nucleoplasm, respectively, and ii) approximately 55% and 30% in the cytoplasm for mitochondria and cytosol, respectively.
Overall, these data demonstrate that MC and the volume occupied by FW can be quantified for each cell compartment.
Changes of macromolecular crowding induced by several chemical nucleolar stress inducers
We investigated whether different chemical nucleolar stress inducers lead to changes in MC in the nuclear and cytoplasmic compartments by testing three RNA synthesis inhibitors with completely different modes of action: CX-5461, DRB, and DAM.
CX-5461 selectively inhibits the initiation of Pol 1 transcription by inhibiting formation of the SL-1 preinitiation complex at the rDNA promoter [11, 27] and is also a G-quadruplex (G4) DNA motif binder (28). When used over a long period, it induces the senescence of cancerous cells of epithelial origin, such as HeLa cells and activates ATM without inducing DNA damage [13]. Immunolocalization of UBF and fibrillarin (Fig S1) showed that CX-5461 induced complete reorganization of the nucleolar components relative to that of control cells. In control cells (Fig S1 A), the nucleoli were large and irregular. They contained numerous dots of UBF, each surrounded with a rim of fibrillarin, which is part of the reticulated network. In CX-5461 treated cells, the nucleoli were spherical and surrounded with a rim of condensed chromatin. UBF and fibrillarin were never organized as caps, but rather as numerous small and large dots always in contact with the rim of chromatin (Fig S1 B).
DRB inhibits CK2 kinase [33], which phosphorylates many substrates [34], amongst which UBF [35] and numerous spliceosomal proteins [36]. It inhibits early processing of both rRNA and mRNA molecules [10] but doesn't induce caps [37]. Conversely, it induces the characteristic dissociation of nucleolar granular component from nucleolar fibrillar components (fibrillar centers associated with a dense fibrillar component) that results in spread-out necklace-like structures [37]. Recently, it was shown that such dissociation is due to inhibition, by DRB, of the synthesis of alu element-containing RNAs [38], which maintain the cohesion of nucleolar components [39].
DAM directly interacts with DNA. At low concentrations, it intercalates into rDNA genes and inhibits Pol I progression, inducing rapid inhibition of rRNA synthesis [10] and extensive reorganization of the nucleolar components into light and dense caps [40, 41]. At high concentrations, it inhibits Pol I, Pol II, and Pol III progression; it also generates double-strand breaks in DNA [26] and finally induces apoptosis [25].
We performed the analysis in triplicate for each drug. Briefly, we divided the cell cultures into two parts: one in which the cells were not treated with the drug (control) and one in which the cells were treated with the chosen drug at the concentration and for the time indicated above. Numerous cells were analyzed (in which numerous sub compartments were also analyzed) for each condition to quantify dry mass and water content in different ROI, i.e.: condensed chromatin, nucleolar DFC, GC, and FC, nucleoplasm, cytosol, and mitochondria. These data were collected and used to calculate the mean MC in each ROI of control and treated cells. MC within the ROI of treated cells changed markedly relative to the same ROI of control cells (Figure 1C). CX-5461 induced a strong increase in MC which reached 65 to 80% in condensed chromatin, nucleolar DFC and GC (of note: FC were no longer observed within CX-5461 treated cells), nucleoplasm, and cytosol, whereas it reached 100% in mitochondria. DRB induced a modest increase in MC, which reached approximately 60 and 50% in condensed chromatin and nucleolar DFC and GC, respectively. MC didn't change in the FC, nucleoplasm, or cytosol, whereas it strongly increased to 80% in the mitochondria. Conversely, DAM induced a strong decrease in MC in all cell compartments of non-apoptotic cells, dropping to only 10 to 20% (apoptotic cells were not investigated in the present study).
Overall, these data show that the MC of cell compartments increases following treatment with CX-5461 and DRB, whereas it decreases following DAM treatment.
Moreover, we calculated how these data change if the hydration value of 0.5 g of water per g of dry matter (see material and method section) was 0.3 g, 0.4g or 0.6g as proposed in some studies [42]. We found (results not shown) that, compared to MC calculated with 0.5g value, MC decreases by around 16% or 8 % or increases by 8 % when hydration value is 0.3, 0.4 or 0.6 respectively.
Changes of mitochondrial ultrastructure induced by CX-5461, DRB, and DAM treatment
Considering that CX-5461, DRB and DAM treatments induce strong changes in MC of all cell compartments, we investigated whether they induce ultrastructural changes in terms of shrinking or swelling of organelles. As an example we compared the structure of mitochondria imaged within ultrathin cryo-sections of control or CX-5461, DRB or DAM treated cells (Fig S2 A). Clearly, we evidenced that typical tubular mitochondria containing cristae were evidenced in all conditions. However, by measuring the diameter of mitochondria (Fig S2 B), we found that the diameter of mitochondria in CX-5461 and DRB treated cells were shorter than in control cells (152, 179 and 259 nm respectively). At the opposite, the diameter of mitochondria in DAM-treated cells was similar to that of control cells (255 nm).
Changes in elemental content induced by CX-5461, DRB, and DAM
We investigated whether CX-5461, DRB, and DAM induce changes in the content of the main elements (N, P, K, Na, Cl, and S) by quantifying them by energy dispersive X-ray spectrometry (EDXS) in ROI of cell compartments in control and treated cells as described above.
We calculated the elemental content in mmol/L by considering the water content previously measured in the exact same ROI [23]. The changes in elemental content in treated cells were large. Thus, we simplified the presentation of the data by showing the increase or decrease of elemental content relative to control cells (Figure 2). In cells treated with CX-5461, the elemental content strongly increased in all cell compartments (Figure 2A). Setting the content in the ROI of control cells to 100%, the elemental content increased approximately to between 150 and 250% in condensed chromatin, nucleolar DFC and GC, and mitochondria, whereas it increased to 300 to 400 % in the nucleoplasm and cytosol. N increased to approximately 500% in the nucleoplasm and mitochondria. In cells treated with DRB, the elemental content increased to between 150 and 300% relative to that of control cells in all cell compartments. In contrast, cells treated with both low and high concentration of DAM showed a large decrease in the content of all elements, which dropped to only 25 to 50% of that of control cells. Cl- showed the largest decrease, dropping to approximately 15% of the value of control cells in the nucleoplasm, cytosol, and mitochondria (Figure S3).
Quantification of the main elements (N, P, K, Na, Cl, and S) by energy dispersive X-ray spectrometry (EDXS) in regions of interest (ROI) of compartments in control cells and cells treated with CX-5461, DRB, or DAM. For clarity, data are shown as the percentage relative to control cells (100%). A) Cells treated with CX-5461 for 30 h (n = 61 cells), B) cells treated with DRB for 6 h (n = 62 cells), C) cells treated with DAM (low and high concentration) for 4 and 7 h, respectively (n = 39 non apoptotic cells). Condensed chromatin (cond.chr.), nucleolar dense component (DFC), nucleolar granular component (GC), nucleolar fibrillar centers (FC), nucleoplasm (nucleopl.), cytosol, and mitochondria (mitoch.). Data are the means of three separate experiments +/- 1 standard deviation.
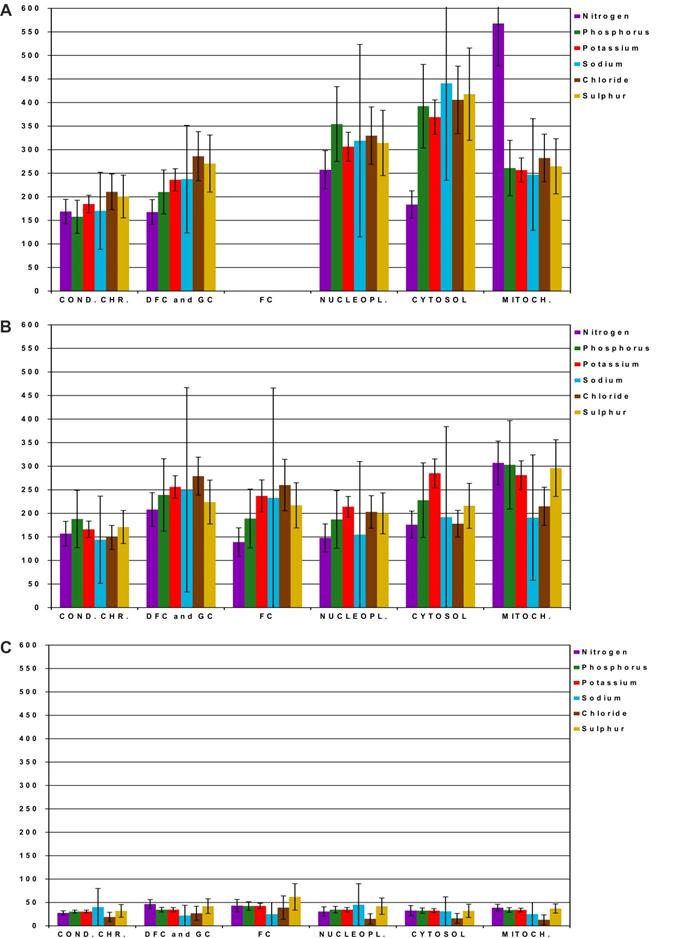
Thus, the main elemental content of cell compartments increased in response to CX-5461 and DRB, whereas it decreased in response to DAM treatment.
Changes in the localization of misfolded and hydrophobic proteins induced by CX-5461, DRB, and DAM
We investigated whether the large changes in MC induced by CX-5461, DRB, and DAM, were concomitant to changes in the localization of misfolded and hydrophobic proteins, by incubating living cells with a dye, 8-Anilinonaphtalene-1-sulfonic acid (ANS), which binds to the hydrophobic pockets of proteins and to unfolded proteins [32]. Under these conditions, ANS becomes highly fluorescent and can be imaged using two-photon microscopy. Z-stacks containing approximately 60 slices were simultaneously acquired in two channels: H2B-GFP fluorescence for chromatin imaging and ANS fluorescence for hydrophobic and unfolded protein localization. We then processed the z-stacks to perform 3D surface rendering of H2B-GFP and ANS fluorescence. The upper half of each cell was removed to visualize ANS fluorescence in the interior of the cytoplasm and the nucleus (Figure 3). In control cells (Figures 3A1 and 3A2), ANS fluorescence in the cytoplasm was present in reticulated structures, in a continuous layer located close to the nuclear envelope, and was absent from the nucleus and, more particularly, the nucleoli (red arrows), as previously described [32, 43]. We subjected the cells to heat shock by placing them at 42°C for 3 hours as previously shown, to obtain a positive control for ANS fluorescence in the nucleus [32, 43]. Under these conditions (Figures 3A3 and 3A4), ANS fluorescence was clearly detectable in the nucleolus (blue arrow in Figure 3A4). After treatment of the cells with CX-5461 (Figure 3B1 and 3B2), ANS fluorescence was higher in the cytoplasm and more compact than that in control cells. However, ANS fluorescence was present neither in the nucleus nor in the nucleolus (red arrow). We obtained the same results after DRB treatment (Figures 3C1 and 3C2). After treatment of the cells with DAM (Figures 3D1 and 3D2), ANS fluorescence in the cytoplasm was lower than that in control cells: it was both present in reticulated structures and absent from large sub volumes of the cytoplasm. Similar to CX-5461 and DRB treatments, ANS fluorescence was visible neither in the nucleus nor in the nucleoli (red arrows).
Three-dimensional visualization of misfolded and of hydrophobic proteins shown by ANS fluorescence (blue channel) in HeLa cells stably expressing H2B-GFP (green channel) by confocal microscopy. Control cells and cells treated with CX-5461, DRB, or DAM without heat-shock ((-) hs) or with heat-shock for 3 h ((+) hs). The upper half of each cell was removed to show the internal 3D distribution of fluorescence. A1 to A4) Control cells before heat-shock ((-) hs) or after heat-shock ((+) hs). B1 to B4) Cells treated with CX-5461 for 30 h without heat-shock ((-) hs) or followed by heat-shock ((+) hs). C1 to C4) Cells treated with DRB for 6 h without heat-shock ((-) hs) or followed by heat-shock ((+) hs). D1 to D4) Cells treated with DAM for 7 h without heat-shock ((-) hs) or followed by heat-shock ((+) hs). Red arrows point to nucleoli without ANS fluorescence and blue arrows to nucleoli with ANS fluorescence after heat-shock (control cells and cells treated with DAM). Scale bar is 10 µm for all images.
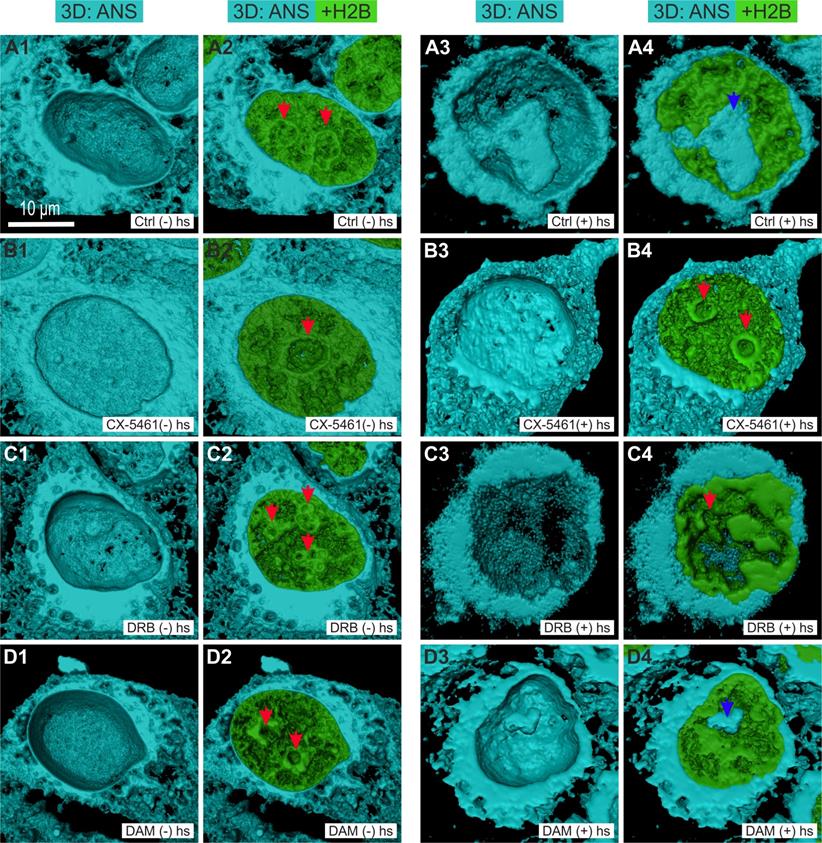
We investigated whether cells previously treated with CX-5461, DRB, or DAM are sensitive to heat-shock by incubating them at 42°C for 3 hours at the end of each treatment. Under these conditions, we observed no nucleolar ANS fluorescence for cells previously treated with CX-5461 or DRB (Figures 3B3, 3B4, 3C3 and 3C4; red arrows point to the nucleoli), but cells previously treated with DAM showed detectable ANS fluorescence (Figures 3D3 blue arrow on Figure 3D4).
Thus, a shift of misfolded and hydrophobic proteins to the nucleolus was not induced by CX-5461, DRB, or DAM treatment alone, but was induced by heat shock in control and DAM-treated cells.
Intranuclear localization of phosphorylated NBS1 in cells treated with CX-5461, DRB, or DAM
It was recently demonstrated [13] that CX-5461 does not induce DNA double-strand breaks but activates non-canonical ATM/ATR signaling (Ataxia-Telangiectasia Mutated kinase/ATM Rad-3 related) [44]. Such activation induces the translocation of phosphorylated Nijmegen Breakage Syndrome 1 (p-NBS1) to the nucleus and, more particularly, to the nucleolus. High concentrations of DAM generate DNA double- strand breaks [45] and phosphorylation of the core histone variant γ-H2AX, which localizes to RNA nuclear bodies [26, 46]. These findings prompted us to compare the nuclear and, more particularly, the nucleolar localization of p-NBS1 after CX-5461, DRB, or DAM treatment. We simultaneously compared immuno-localization of p-NBS1 to that of UBF by recording z-stacks of images by confocal microscopy. In control cells, p-NBS1 localized neither to the cytoplasm nor the nucleus (results not shown). Moreover, we controlled that p-NBS1 was not present in the nuclei of cells treated with DRB (results not shown), as DRB does not activate ATM [47]. One section passing through the nucleus (figure 4A) showed p-NBS1 to be distributed as dots 0.4 to 0.8 µm in diameter both outside and within the nucleoli of cells treated with CX-5461 for 30 h. Those outside the nucleoli were located at the border of condensed chromatin, whereas those within were located between the spherical nucleoli and the condensed chromatin lining the nucleoli. We simultaneously visualized the chromatin in the entire nucleus (by transparent surface rendering), p-NBS1 in 3D (by compact surface rendering), and UBF in 3D (by transparent surface rendering) (figure 4B). This view showed p-NBS1 in the nucleoplasm to be distributed as 20 to 30 dots in which UBF was never co-localized. In contrast, nucleolar p-NBS1 was distributed as 5 to 15 dots (depending on the size of the nucleolus) which were co-localized with similar dots of UBF. A higher magnification view of the largest nucleolus (Figure 4C) showed all the dots containing both p-NSB1 and UBF to be located on the surface of the spherical nucleolus.
Immunolocalization of phosphorylated NBS1 (NBS1) (red channel) and UBF (blue channel) in HeLa cells stably expressing H2B-GFP (green channel) treated with CX-5461 or DAM by confocal microscopy. A to C) Cells treated with CX-5461 for 30 h: A) one optical section; B) 3D visualization of chromatin (transparent green), NBS1 (red surface rendering), and UBF (blue transparent surface rendering); C) zoom of one nucleolus, showing surface rendering of chromatin (green), NBS1 (red), and UBF (transparent blue). D to F) Non-apoptotic cells treated with DAM for 7 h: D) one optical section; E) 3D visualization of chromatin (transparent green), NBS1 (red surface rendering), and UBF (blue transparent surface rendering); F) zoom of one nucleolus, showing chromatin (green), NBS1 (red), and UBF (transparent blue). NU(nucleolus). Scale bar is 5 µm for images A, B, D, E and 2 µm for images C and F.
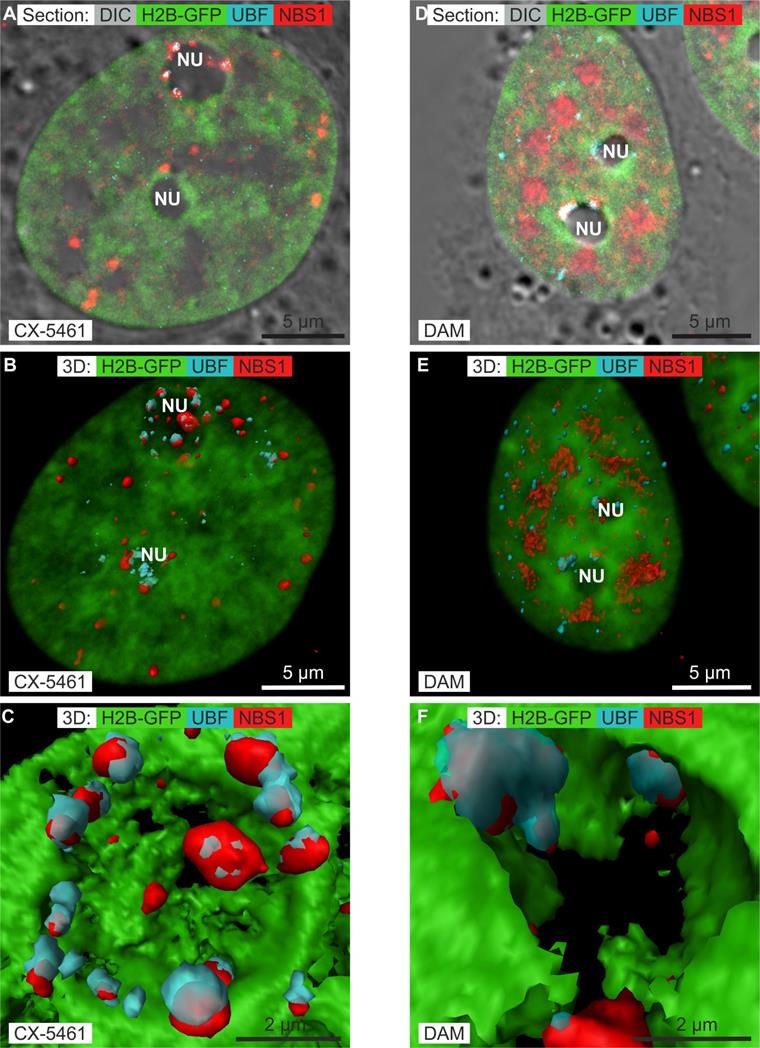
One section passing through the nucleus of non-apoptotic cells treated with the high concentration DAM for 7 h (figure 4D) showed p-NBS1 to be much more abundant than in CX-5461 treated cells and to be located both outside and within the nucleoli. In the nucleoplasm, p-NBS1 was distributed throughout large areas located in between clumps of condensed chromatin. In the nucleoli, p-NBS1 was located in typical caps that also contained UBF. We simultaneously visualized the chromatin in the whole nucleus (by transparent surface rendering), p-NBS1 in 3D (by compact surface rendering), and UBF in 3D (by transparent surface rendering) (Figure 4E). This view showed p-NBS1 in the nucleoplasm to be distributed within approximately 10 large irregular structures of 1.5 to 2 µm in size in which UBF was not co-localized. A higher magnification view of the largest nucleolus (Figure 4F) showed p-NBS1 and UBF to be systematically co-localized within canonical caps.
These data show that p-NBS1 and UBF co-localized to the periphery of nucleoli when cells were treated with CX-5461 and DAM, but not when they are treated with DRB.
Intranuclear localization of NF-κB in cells treated with CX-5461, DRB or DAM
Numerous anti-cancerous drugs induce the translocation of NF-κB to the nucleus [48]. Recently, it was shown that treatment with DAM at low concentrations induces translocation of NF-κB to the nucleus and the transcription of NF-κB regulated genes [49]. Aspirin induces the NF-κB pathway and translocation of NF-κB to the nucleolus [50, 51]. We thus investigated whether the same phenomenon occurs in cells treated with CX-5461, DRB, or DAM. We localized phospho-NF-κB (pNF-κB) by confocal microscopy. pNF-κB was absent from the cytoplasm and nucleus of control cells (results not shown). We obtained the same result for cells treated with CX-5461 and DRB (results not shown). Treatment of the cells with high concentration of DAM resulted in detectable pNF-κB in the cytoplasm and more in the nucleus of non-apoptotic cells (figure 5A and D). In the nucleus, pNF-κB was distributed as several dots within clumps of chromatin and within large structures at the periphery of the nucleoli where it was not co-localized with UBF (Figure 5A) nor fibrillarin (Figure 5D). We simultaneously visualized chromatin in the whole nucleus by transparent surface rendering and pNF-κB, caps of UBF (Figure 5B) or caps of fibrillarin (Figure 5E) by compact surface rendering. These views showed pNF-κB to be distributed in the cytoplasm and nucleoplasm as rare dots, whereas it was present within large caps in the nucleolus. A higher magnification view showed the caps of pNF-κB to overlap with neither the caps of UBF (Figure 5C) nor those of fibrillarin (Figure 5F).
Immunolocalization of phosphorylated NF-κB (NF-κB) (red channel) in non-apoptotic HeLa cells stably expressing H2B-GFP (green channel) treated with DAM for 7 h by confocal microscopy. A to C) Co-localization of NF-κB (red) and UBF (blue): A) one optical section; B) 3D visualization of chromatin (transparent green), NF-κB (red surface rendering), and UBF (blue transparent surface rendering); C) zoom of one nucleolus, showing chromatin (green), NF-κB (red), and UBF (blue). D to E) Co-localization of NF-κB (red) and fibrillarin (blue): D) one optical section; E) 3D visualization of chromatin (transparent green), NF-κB (red surface rendering), and fibrillarin (blue surface rendering); F) zoom of one nucleolus, showing chromatin (green), NF-κB (red), and fibrillarin (blue). NU (nucleolus). Scale bar is 5 µm for images A, B, D, E and 2 µm for images C and F.
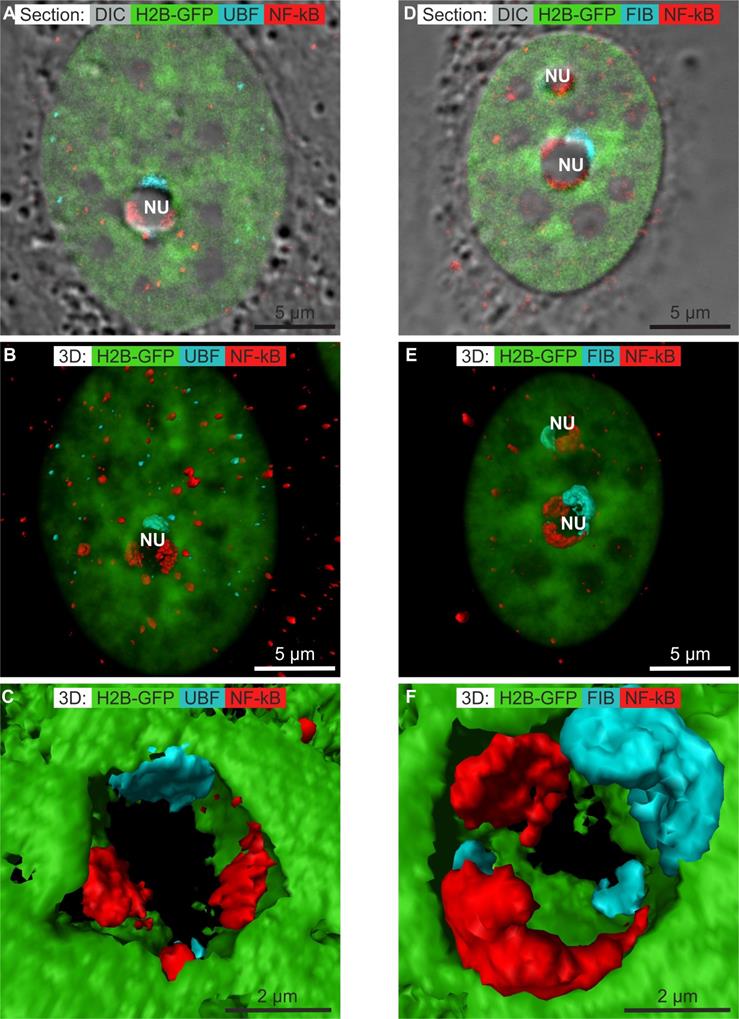
These data show that only DAM treatment induced the localization of pNF-κB to within nucleolar caps that do not contain UBF nor fibrillarin.
Discussion
Changes in cellular processes and metabolism correlate with changes in various cellular biophysical parameters, such as the volume of the cells, volume of their compartments, macromolecular crowding (MC), stiffness, diffusion of macromolecules, dry mass, and water content [14, 22, 52].
Here, we used a novel approach to investigate the effects of chemotherapeutic nucleolar stress inducers [8, 12, 53] by addressing how they affect various cellular biophysical parameters, in particular, dry mass, water, and elemental content. We used a cryo-correlative analytical method that we previously developed [23] to directly quantify these parameters in targeted nano-regions of various cellular compartments. We used the resulting data to calculate the percentage of the volume occupied by hydrated molecules (i.e. MC) and that occupied by free water (FW). For the calculation of MC, we chose a given hydration value of macromolecules (g of water/g of dry matter). It is admitted that hydration of macromolecules can vary from 0.3 to 0.65 g (42). However, as it is unknown whether the value of hydration of macromolecules varies from one cell compartment to another one, we decided to use a median hydration value of 0.5 g which is classically admitted (19). Here, we show that the treatment of cells with different chemotherapeutic nucleolar stress inducers results in opposite changes in MC and elemental content. We were able to correlate these changes with the sensitivity of treated cells to heat-shock and the localization of pNBS1 and pNF-kB in the nucleolus.
Control cells
MC affects the diffusion of solute molecules, protein folding, enzyme catalysis, and metabolism [19, 20]. Our data provide detailed insights into the relationship between MC (and FW) and the main functions of the nuclear and cytoplasmic compartments.
In the nucleolus, we show that FCs, where rDNA loops are transcribed [54, 55], are highly hydrated (MC = 20%, FW = 80%), whereas DFC/GC, where rRNAs are processed [55], are much more crowded (MC = 40%, FW = 60%). Outside of the nucleolus, mRNA synthesis and processing in the nucleoplasm take place in a highly hydrated compartment (MC = 25%, FW = 75%), whereas transcriptionally inactive condensed chromatin is highly crowded (MC = 50%, FW = 50%). We also show that 50 to 60 % of the volume of the so-called nuclear “dense compartments”, such as nucleolar DFC and GC and condensed chromatin, is made up of FW. These data are consistent with the previously proposed “sponge model” of nuclear organelles [56] and the capacity of nuclear proteins to diffuse and visit the entire nucleus, even the denser compartments [57].
Our study shows that the cytosol, in which most of metabolism steps take place outside of any membrane, is highly hydrated (MC = 30%, FW = 70%). Recent studies [58] demonstrated that cell metabolism is optimal when MC is approximately 37% and is less efficient below and above this value because all reactions are either diffusion limited or at saturation when MC approaches 22 to 80% respectively. The values of MC we measured in the cytosol and mitochondria are in the range required for optimal cell metabolism. It has also been calculated [21] that production of the same amount of energy from glucose requires 5 to 50 times less space in the cytosol by fermentation than in mitochondria by oxidative phosphorylation (OxPhos), due to MC. Our finding that MC in the cytosol (30%) is close to the optimal value of 37% is consistent with mixed OxPhos/fermentation metabolism (overflow metabolism) and the known limited OxPhos capacity in the mitochondria of HeLa cells [59].
The highest MC among all cell compartments we studied was found in mitochondria (55%). This result is consistent with the fact that proteins of the matrix, which represent 67% of all mitochondrial proteins, reach the high concentration of 56% [60]. However, our finding that 45% of the volume is made of FW also agrees with the model of enzyme clustering in membrane-associated complexes, which allows a high rate of diffusion of solutes in the matrix [61].
Our quantification of MC can also provide insight on stiffness and viscosity. Indeed, it is known that viscosity increases exponentially with MC [62]. Moreover, micro-viscosity, which governs the translation and rotation of molecules, was recently measured in various cell compartments of living cells [63]. It was shown that micro-viscosity strongly increases from the cytosol to nucleus and mitochondria. Our present data offer the opportunity to correlate MC and micro-viscosity, although they are different biophysical parameters. Thus, we can deduce that a low MC (30% in the cytosol) correlates with a low micro-viscosity (35 cPg), whereas a higher MC (55% in the mitochondria) correlates with a very high micro-viscosity (325 cPg).
Nucleolar stress inducers
The chemical inhibitors we studied here were chosen due to their highly distinct effects on rRNA synthesis and processing and their induction of a nucleolar stress. In control HeLa cells we studied here, it is known that p53 is degraded by the HPV E6 oncoprotein (64). However, as p53 quantity is strongly increased in HeLa cells treated with CX-5461 (65), with DRB (66) or with DAM (67), we consider that nucleolar stress is p53-dependent in these treated cells. Our study revealed that CX-4561, DRB, and DAM induced distinctive, thus far unrecognized, changes in MC and FW and elemental content in all cell compartments. Each individual treatment induced highly similar changes in all cell compartments, but each of the three nucleolar stressors induced different global changes.
CX-5461 induces specific total inhibition of rRNA transcription [27], which is a condition to maintain senescence [68]. We observed a strong increase of both MC and elemental content and a strong decrease of FW, which could alter biophysical and metabolic characteristics. Thus, our findings suggest that these changes may severely limit the diffusion of solutes, as shown in other conditions [17, 52], tune weak interactions [18], and increase intrinsic stiffness, as observed for senescent [69] and aging cells [70].
DRB treatment induced a moderate increase of MC in all cell compartments, except mitochondria, and a two-fold increase in elemental content. These limited changes may represent a biophysical marker of the characteristic nucleolar modifications induced by DRB treatment, which include: i) inhibition of the early processing of rRNA and mRNA molecules but not rRNA transcription [10], ii) inhibition of the synthesis of alu element-containing RNA, which induces the expansion of the nucleolar structure [38, 39], but without marked reorganization of the nucleolar components, such as their segregation or capping, iii) moderate changes in the abundance of ribosomal proteins in the nucleolus [71], and iv) reversibility of the nucleolar structural and functional changes following the removal of DRB [37], in contrast to CX-5461 and DAM treatment.
Conversely, we found that the inhibition of transcription by RP I, RP II, and RP III with the high concentration of DAM induced a dramatic decrease of MC in all cell compartments. This result is consistent with analysis of the nucleolar proteome, demonstrating that DAM treatment induces a decrease in the abundance of numerous nucleolar proteins [71]. Moreover, lower MC is associated with lower stiffness [62]. Thus, the lower nucleolar MC we measured agrees with the decrease in stiffness previously quantified by atomic force microscopy on isolated nucleoli of DAM-treated cells [72].
We demonstrated that none of the three tested drugs induced reorganization or deposition of misfolded or hydrophobic proteins in the nucleus by ANS staining. However, we showed that only DAM-treated cells were sensitive to an environmental change, such as heat-shock. This finding reinforces the working hypothesis that cells become sensitive to environmental changes when they acquire a low MC and that an increase in MC is protective [22].
We showed that none of the three tested drugs induced a change in the classical tubular structure of mitochondria and of cristae. However, two of these drugs (CX-5461 and DRB) induced a diminution of their diameter whereas the three drugs induce a change of mitochondrial MC. As cellular metabolism, and particularly that of glucose, depends on MC [21], the changes in MC in mitochondria due to drug treatment may induce dramatic effects on metabolism. Indeed, the large increase of MC in mitochondria (100%) and cytosol (70%) in senescent cells induced by CX-5461 is in agreement with three well-known characteristics of senescent cells [73, 74]: i) limited mitochondrial activity, ii) a shift to glycolysis, and iii) a drop in ATP production that we hypothesize to be due to less efficient glycolysis than in control cells.
The low MC of cytosol and mitochondria (10 and 20% respectively) in non-apoptotic DAM-treated cells suggests higher mitochondrial activity than in control cells. This is consistent with our previous finding [25] that mitochondrial activity increases by 30 to 40% several hours following DAM treatment and then abruptly decreases before the cells engage in apoptosis.
The DNA damage response (DDR) pathway may be activated by diverse stimuli [44]. CX-5461 and DAM activate non-canonical [13] and canonical [26] DDR responses, respectively. By co-localizing phosphorylated Nijmegen breakage syndrome protein 1 (pNBS1), one component of the MRN/ATM complex, with UBF which always binds to rDNA repeats in these treated cells [13], we showed that these two proteins always overlap within the nucleolar domain. This confirms the association of pNBS1 and rDNA upon activation of the DDR response [13, 75]. Here, we show that non-canonical and canonical DDR activation take place in cells with high and low MC, respectively, representing two different biophysical conditions. However, further experiments are needed to determine whether these changes are the consequence, cause or have no link with these two types of DDR activation.
Many chemotherapeutic drugs activate the NF-κB pathway [48]. A recent study showed that DAM at low concentrations induces the phosphorylation of NF-κB, its translocation to the nucleus, and the activation of several NF-κB regulated genes [49]. Here, we showed that, among the three tested drugs, only DAM treatment at a high concentration induced the nuclear translocation of pNF-κB. In these pre-apoptotic cells [25], pNF-κB exclusively localized to nucleolar caps that contained neither UBF nor fibrillarin. Such nucleolar localization is consistent with previous findings showing that proapoptotic treatment with aspirin [50] or other numerous active molecules [76] induces the localization of pNF-κB to the nucleolus. Such nucleolar localization is considered to be due to the sequestration of pNF-κB, which decreases the transcription of NF-κB-driven anti-apoptotic genes and, consequently, induces apoptosis [51]. The translocation of pNF-κB from the nucleoplasm to nucleolus takes place only after several hours of aspirin treatment [50]. We hypothesize that a similar phenomenon takes place following DAM treatment, in which changes arise in two main steps during which mitochondrial activity successively increases and decreases before apoptosis, as we previously showed [25]. Thus, DAM first rapidly inhibits rDNA transcription [10, 13]. Concomitantly, DAM (at low or high concentration) induces a strong decrease in MC and elemental content, particularly Cl- (this work). Although we do not know the cause of these phenomena, it is likely that the decrease of Cl- content promotes NF-κB activation and its translocation to the nucleus, as demonstrated in normal [77] and cancerous cells [78]. DAM at low doses induces activation of NF-κB and of its target genes [49]. We thus hypothesize that the same is true during first period after treatment with a high dose of DAM, as in our study. The activation of NF-κB may induce an increase in mitochondrial metabolism [79] and the expression of antioxidant proteins to protect the cells from ROS toxicity [80]. The lower MC we observed also favors higher mitochondrial metabolism, as stated above. During a second step, the sequestration of pNF-κB to the nucleolus results in a decrease in NF-κB-driven transcription [51]. As NF-κB-driven transcription is concomitant to the total inhibition of RPI, RPII, and RPIII by the high dose of AMD, we propose that this induces: i) cessation of the synthesis of mitochondrial scavengers, ii) damage to the highly active mitochondria, similarly to the action of a NF-κB inhibitor [81], and finally iii) apoptosis [25].
Conclusion
Numerous studies have addressed the importance of both intracellular water homeostasis [82] and of MC [19, 20, 22]. Recent studies have demonstrated that changes in MC and water efflux can result from various stresses, such as glucose starvation [52], cell spreading, and osmotic compression [17]. We show that three nucleolar stress inducers, CX-5461, DRB, and DAM, which inhibit rRNA and mRNA synthesis and/or processing, also induce marked, thus far unrecognized, changes in MC, FW and elemental content. Thus, the changes we observed reinforce the notion that the type of therapy may influence the metabolic reprogramming of cancer cells [83], as cellular metabolism is dependent on MC [21]. In the future, it will be necessary to test: i) whether other nucleolar stress inducers result in changes to MC and elemental content and ii) whether tumors treated with chemotherapeutic drugs that induce an increase in FW and a decrease in elemental content are more sensitive, in vivo, to additional treatment, such as hyperthermia [84] or ionizing radiation, which induces water radiolysis [85].
Acknowledgements
This work was supported by INSERM (Physicancer program: Noci-cytox) and the Region of Champagne Ardenne.
We thank the Platform of Cell and Tissue Imaging (PICT) of URCA University, Reims, France, for making the equipment available. We also thank Nicolas Ploton for schemes of the graphical abstract.
Supplementary Material
Supplementary figures.
Competing Interests
The authors have declared that no competing interest exists.
References
1. Boulon S, Westman BJ, Hutten S, Boisvert FM, Lamond AI. The nucleolus under stress. Mol Cell. 2010;40:216-227
2. Grummt I.The nucleolus—guardian of cellular homeostasis and genome integrity. Chromosoma. 2013; 122: 487-97.
3. Hoppe S, Bierhoff H, Cado I, Weber A, Tiebe M, Grummt I, Voit R. AMP-activated protein kinase adapts rRNA synthesis to cellular energy supply. Proc Natl Acad Sci U S A. 2009;106:17781-17786
4. Rubbi CP, Milner J. Disruption of the nucleolus mediates stabilization of p53 in response to DNA damage and other stresses. EMBO J. 2003;22:6068-6077
5. Vlatković N, Boyd MT, Rubbi CP. Nucleolar control of p53: a cellular Achilles' heel and a target for cancer therapy. Cell Mol Life Sci. 2014;71:771-91
6. Deisenroth C, Zhang Y. The Ribosomal Protein-Mdm2-p53 Pathway and Energy Metabolism: Bridging the Gap between Feast and Famine. Genes Cancer. 2011;2:392-403
7. Russo A, Russo G. Ribosomal Proteins Control or Bypass p53 during Nucleolar Stress. Int J Mol Sci. 2017;18:140
8. Quin JE, Devlin JR, Cameron D, Hannan KM, Pearson RB, Hannan RD. Targeting the nucleolus for cancer intervention. Biochim Biophys Acta. 2014;1842:802-816
9. Derenzini M, Montanaro L, Trerè D. Ribosome biogenesis and cancer. Acta Histochem. 2017;119:190-197
10. Burger K, Mühl B, Harasim T, Rohrmoser M, Malamoussi A, Orban M, Kellner M, Gruber-Eber A, Kremmer E, Hölzel M, Eick D. Chemotherapeutic drugs inhibit ribosome biogenesis at various levels. J Biol Chem. 2010;285:12416-12425
11. Hein N, Hannan KM, George AJ, Sanij E, Hannan RD. The nucleolus: an emerging target for cancer therapy.Trends Mol Med. 2013; 19: 643-654.
12. Woods SJ, Hannan KM, Pearson RB, Hannan RD. The nucleolus as a fundamental regulator of the p53 response and a new target for cancer therapy. Biochim Biophys Acta. 2015;1849:821-829
13. Quin J, Chan KT, Devlin JR, Cameron DP, Diesch J, Cullinane C, Ahern J, Khot A, Hein N, George AJ, Hannan KM, Poortinga G, Sheppard KE, Khanna KK, Johnstone RW, Drygin D, McArthur GA, Pearson RB, Sanij E, Hannan RD. Inhibition of RNA polymerase I transcription initiation by CX-5461 activates non-canonical ATM/ATR signaling. Oncotarget. 2016;7:49800-49818
14. Byun S, Hecht VC, Manalis SR. Characterizing cellular biophysical responses to stress by relating density, deformability and size. Biophys J. 2015;109:1565-1573
15. Stevens MM, Maire CL, Chou N, Murakami MA, Knoff DS, Kikuchi Y, Kimmerling RJ, Liu H, Haidar S, Calistri NL, Cermak N, Olcum S, Cordero NA, Idbaih A, Wen PY, Weinstock DM, Ligon KL, Manalis SR. Drug sensitivity of single cancer cells is predicted by changes in mass accumulation rate. Nat Biotechnol. 2016;34:1161-1167
16. Hecht VC, Sullivan LB, Kimmerling RJ, Kim DH, Hosios AM, Stockslager MA, Stevens MM, Kang JH, Wirtz D, Vander Heiden MG, Manalis SR. Biophysical changes reduce energetic demand in growth factor-deprived lymphocytes. J Cell Biol. 2016;212:439-447
17. Guo M, Pegoraro AF, Mao A, Zhou EH, Arany PR, Han Y, Burnette DT, Jensen MH, Kasza KE, Moore JR, Mackintosh FC, Fredberg JJ, Mooney DJ, Lippincott-Schwartz J, Weitz DA. Cell volume change through water efflux impacts cell stiffness and stem cell fate. Proc Natl Acad Sci U S A. 2017;114:E8618-E8627
18. Sukenik S, Ren P, Gruebele M. Weak protein-protein interactions in live cells are quantified by cell-volume modulation. Proc Natl Acad Sci U S A. 2017;114:6776-6781
19. Zimmerman SB, Minton AP. Macromolecular crowding: biochemical, biophysical, and physiological consequences. Annu Rev Biophys Biomol Struct. 1993;22:27-65
20. Ellis RJ. Macromolecular crowding: obvious but underappreciated. Trends Biochem Sci. 2001;26:597-604
21. Vazquez A, Oltvai ZN. Macromolecular crowding explains overflow metabolism in cells. Sci Rep. 2016;6:31007
22. Mourão MA, Hakim JB, Schnell S. Connecting the dots: the effects of macromolecular crowding on cell physiology. Biophys J. 2014;107:2761-2766
23. Nolin F, Ploton D, Wortham L, Tchelidze P, Balossier G, Banchet V, Bobichon H, Lalun N, Terryn C, Michel J. Targeted nano analysis of water and ions using cryocorrelative light and scanning transmission electron microscopy. J Struct Biol. 2012;180:352-61
24. Nolin F, Michel J, Wortham L, Tchelidze P, Balossier G, Banchet V, Bobichon H, Lalun N, Terryn C, Ploton D. Changes to cellular water and element content induced by nucleolar stress: investigation by a cryo-correlative nano-imaging approach. Cell Mol Life Sci. 2013;70:2383-94
25. Nolin F, Michel J, Wortham L, Tchelidze P, Banchet V, Lalun N, Terryn C, Ploton D. Stage-Specific Changes in the Water, Na+, Cl- and K+ Contents of Organelles during Apoptosis, Demonstrated by a Targeted Cryo Correlative Analytical Approach. PLoS One. 2016;11:e0148727
26. Bensaude O. Inhibiting eukaryotic transcription: Which compound to choose? How to evaluate its activity? Transcription. 2011;2:103-108
27. Drygin D, Lin A, Bliesath J, Ho CB, O'Brien SE, Proffitt C, Omori M, Haddach M, Schwaebe MK, Siddiqui-Jain A, Streiner N, Quin JE, Sanij E, Bywater MJ, Hannan RD, Ryckman D, Anderes K, Rice WG. Targeting RNA polymerase I with an oral small molecule CX-5461 inhibits ribosomal RNA synthesis and solid tumor growth. Cancer Res. 2011;71:1418-30
28. Catez F, Dalla Venezia N, Marcel V, Zorbas C, Lafontaine DLJ, Diaz JJ. Ribosome biogenesis: An emerging druggable pathway for cancer therapeutics. Biochem Pharmacol. 2019;159:74-81
29. Nolin F, Ploton D, Wortham L, Tchelidze P, Bobichon H, Banchet V, Lalun N, Terryn C, Michel J. Targeted nano analysis of water and ions in the nucleus using cryo-correlative microscopy. Methods Mol Biol. 2015;1228:145-158
30. Casanova G, Nolin F, Wortham L, Ploton D, Banchet V, Michel J. Shrinkage of freeze-dried cryosections of cells: Investigations by EFTEM and cryo-CLEM. Micron. 2016;88:77-83
31. Rickwood D, Birnie GD. Metrizamide, a new density-gradient medium. FEBS Lett. 1975;50:102-10
32. Hadley KC, Borrelli MJ, Lepock JR, McLaurin JA, Croul SE, Guha A, Chakrabartty A. Multiphoton ANS fluorescence microscopy as an in vivo sensor for protein misfolding stress. Cell stress and chaperones. 2011;16:549-561
33. Louvet E, Junéra HR, Berthuy I, Hernandez-Verdun D. Compartmentation of the nucleolar processing proteins in the granular component is a CK2-driven process. Mol Biol Cell. 2006;17:2537-46
34. Nuñez de Villavicencio-Diaz, Rabalski A, Litchfield DW. Protein Kinase CK2: Intricate Relationships within Regulatory Cellular Networks. Pharmaceuticals. 2017;10:27
35. Panova TB, Panov KI, Russell J, Zomerdijk JC. Casein kinase 2 associates with initiation-competent RNA polymerase I and has multiple roles in ribosomal DNA transcription. Mol Cell Biol. 2006;26:5957-68
36. Bian Y, Ye M, Wang C, Cheng K, Song C, Dong M, Pan Y, Qin H, Zou H. Global screening of CK2 kinase substrates by an integrated phosphoproteomics workflow. Sci Rep. 2013;3:3460
37. Louvet E, Junéra HR, Le Panse S, Hernandez-Verdun D. Dynamics and compartmentation of the nucleolar processing machinery. Exp Cell Res. 2005;304:457-70
38. Caudron-Herger M, Pankert T, Seiler J, Németh A, Voit R, Grummt I, Rippe K. Alu element-containing RNAs maintain nucleolar structure and function. EMBO Journal. 2015;34:2758-74
39. Caudron-Herger M, Pankert T, Rippe K. Regulation of nucleolus assembly by non-coding RNA polymerase II transcripts. Nucleus. 2016;7:308-318
40. Shav-Tal Y, Blechman J, Darzacq X, Montagna C, Dye BT, Patton JG, Singer RH, Zipori D. Dynamic sorting of nuclear components into distinct nucleolar caps during transcriptional inhibition. Mol Biol Cell. 2005;16:2395-413
41. Tchelidze P, Benassarou A, Kaplan H, O'Donohue MF, Lucas L, Terryn C, Rusishvili L, Mosidze G, Lalun N, Ploton D. Nucleolar sub-compartments in motion during rRNA synthesis inhibition: Contraction of nucleolar condensed chromatin and gathering of fibrillar centers are concomitant. PLoS One. 2017;12:e0187977
42. Bellissent-Funel MC. Hydration in protein dynamics and function. J. Mol. Liquids. 2000;84:39-52
43. Jacob MD, Audas TE, Uniacke J, Trinkle-Mulcahy L, Lee S. Environmental cues induce a long noncoding RNA-dependent remodeling of the nucleolus. Mol. Biol. Cell. 2013;24:2943-2953
44. Burgess RC, Misteli T. Not All DDRs Are Created Equal: Non-Canonical DNA Damage Responses. Cell. 2015;162:944-7
45. Ross WE, Bradley MO. DNA double-strand breaks in mammalian cells after exposure to intercalating agents. Biochim Biophys Acta. 1981;654:129-134
46. Mischo HE, Hemmerich P, Grosse F, Zhang S. Actinomycin D induces histone g-H2AX foci and complex formation of g-H2AX with Ku70 and nuclear DNA helicase II. The J Biol Chem. 2005;280:9586-9594
47. Tresini M, Warmerdam DO, Kolovos P, Snijder L, Vrouwe MG, Demmers JAA, Van IJcken WFJ, Grosveld FG, Medema RH, Hoeijmakers JHJ, Mullenders LHF, Vermeulen W, Marteijn JA. The core spliceosome as target and effector of non-canonical ATM signaling. Nature. 2015;523:53-58
48. Godwin P, Baird AM, Heavey S, Barr MP, O'Byrne KJ, Gately K. Targeting nuclear factor-kappa B to overcome resistance to chemotherapy. Front Oncol. 2013;3:120
49. Liu XF, Xiang L, Zhou Q, Carralot JP, Prunotto M, Niederfellner G, Pastan I. Actinomycin D enhances killing of cancer cells by immunotoxin RG7787 through activation of the extrinsic pathway of apoptosis. Proc Natl Acad Sci U S A. 2016;113:10666-71
50. Stark LA, Dunlop MG. Nucleolar sequestration of RelA (p65) regulates NF-kappaB-driven transcription and apoptosis. Mol Cell Biol. 2005;25:5985-6004
51. Chen J, Stark LA. Aspirin Prevention of Colorectal Cancer: Focus on NF-κB Signalling and the Nucleolus. Biomedicines. 2017;5:43
52. Joyner RP, Tang JH, Helenius J, Dultz E, Brune C, Holt LJ, Huet S, Müller DJ, Weis K. A glucose-starvation response regulates the diffusion of macromolecules. Elife. 2016;5:e09376
53. Pickard AJ, Bierbach U. The cell's nucleolus: an emerging target for chemotherapeutic intervention. ChemMedChem. 2013;8:1441-9
54. Cheutin T, O'Donohue MF, Beorchia A, Vandelaer M, Kaplan H, Deféver B, Ploton D, Thiry M. Three-dimensional organization of active rRNA genes within the nucleolus. J Cell Sci. 2002;115:3297-307
55. Thiry M, Lafontaine DL. Birth of a nucleolus: the evolution of nucleolar compartments. Trends Cell Biol. 2005;15:194-9
56. Handwerger KE, Cordero JA, Gall JG. Cajal bodies, nucleoli, and speckles in the Xenopus oocyte nucleus have a low-density, sponge-like structure. Mol Biol Cell. 2005;16:202-11
57. Bancaud A, Huet S, Daigle N, Mozziconacci J, Beaudouin J, Ellenberg J. Molecular crowding affects diffusion and binding of nuclear proteins in heterochromatin and reveals the fractal organization of chromatin. EMBO J. 2009;28:3785-98
58. Vazquez A. Optimal cytoplasmatic density and flux balance model under macromolecular crowding effects. J Theor Biol. 2010;264:356-9
59. Fernandez-de-Cossio-Diaz J, Vazquez A. Limits of aerobic metabolism in cancer cells. Sci Rep. 2017;7:13488
60. Srere PA. The infrastructure of the mitochondrial matrix. Trends Biochem Sci. 1980;5:120-121
61. Partikian A, Olveczky B, Swaminathan R, Li Y, Verkman AS. Rapid diffusion of green fluorescent protein in the mitochondrial matrix. J Cell Biol. 1998;140:821-9
62. Zhou EH, Trepat X, Park CY, Lenormand G, Oliver MN, Mijailovich SM, Hardin C, Weitz DA, Butler JP, Fredberg JJ. Universal behavior of the osmotically compressed cell and its analogy to the colloidal glass transition. Proc Natl Acad Sci U S A. 2009;106:10632-10637
63. Chambers JE, Kubánková M, Huber RG, López-Duarte I, Avezov E, Bond PJ, Marciniak SJ, Kuimova MK. An Optical Technique for Mapping Microviscosity Dynamics in Cellular Organelles. ACS Nano. 2018;12:4398-4407
64. Scheffner M, Werness BA, Huibregtse JM, Levine AJ, Howley PM. The E6 oncoprotein encoded by human papillomavirus types 16 and 18 promotes the degradation of p53. Cell. 1990;63:1129-1136
65. Kang J, Kusnadi EP, Ogden AJ, Hicks RJ, Bammert L, Kutay U, Hung S, Sanij E, Hannan RD, Hannan KM, Pearson RB. Amino acid-dependent signaling via S6K1 and MYC is essential for regulation of rDNA transcription. Oncotarget. 2016;7:48887-48904
66. Hubert A, Paris S, Piret JP, Ninane N, Raes M, Michiels C. Casein kinase 2 inhibition decreases hypoxia-inducible factor-1 activity under hypoxia through elevated p53 protein level. J Cell Sci. 2006;119:3351-3362
67. Hietanen S, Lain S, Krausz E, Blattner C, Lane DP. Activation of p53 in cervical carcinoma cells by small molecules. Proc Natl Acad Sci U S A. 2000;97:8501-8506
68. Yang L, Song T, Chen L, Soliman H, Chen J. Nucleolar repression facilitates initiation and maintenance of senescence. Cell Cycle. 2015;14:3613-23
69. Morgan JT, Raghunathan VK, Chang YR, Murphy CJ, Russell P. The intrinsic stiffness of human trabecular meshwork cells increases with senescence. Oncotarget. 2015;6:15362-74
70. Phillip JM, Aifuwa I, Walston J, Wirtz D. The Mechanobiology of Aging. Annu Rev Biomed Eng. 2015;17:113-141
71. Andersen JS, Lam YW, Leung AK, Ong SE, Lyon CE, Lamond AI, Mann M. Nucleolar proteome dynamics. Nature. 2005;433:77-83
72. Louvet E, Yoshida A, Kumeta M, Takeyasu K. Probing the stiffness of isolated nucleoli by atomic force microscopy. Histochem Cell Biol. 2014;141:365-81
73. Ziegler DV, Wiley CD, Velarde MC. Mitochondrial effectors of cellular senescence: beyond the free radical theory of aging. Aging Cell. 2015;14:1-7
74. Hernandez-Segura A, Nehme J, Demaria M. Hallmarks of cellular senescence. Trends in cell biol. 2018;28:436-453
75. Larsen DH, Stucki M. Nucleolar responses to DNA double-strand breaks. Nucleic Acids Res. 2016;44:538-44
76. Thoms HC, Loveridge CJ, Simpson J, Clipson A, Reinhardt K, Dunlop MG, Stark LA. Nucleolar targeting of RelA(p65) is regulated by COMMD1-dependent ubiquitination. Cancer Res. 2010;70:139-49
77. Yang H, Huang LY, Zeng DY, Huang EW, Liang SJ, Tang YB, Su YX, Tao J, Shang F, Wu QQ, Xiong LX, Lv XF, Liu J, Guan YY, Zhou JG. Decrease of intracellular chloride concentration promotes endothelial cell inflammation by activating nuclear factor-κB pathway. Hypertension. 2012;60:1287-93
78. Wang B, Xie J, He HY, Huang EW, Cao QH, Luo L, Liao YS, Guo Y. Suppression of CLC-3 chloride channel reduces the aggressiveness of glioma through inhibiting nuclear factor-κB pathway. Oncotarget. 2017;8:63788-63798
79. Tornatore L, Thotakura AK, Bennett J, Moretti M, Franzoso G. The nuclear factor kappa B signaling pathway: integrating metabolism with inflammation. Trends Cell Biol. 2012;22:557-66
80. Morgan MJ, Liu ZG. Crosstalk of reactive oxygen species and NF-κB signaling. Cell Res. 2011;21:103-15
81. Vaisitti T, Gaudino F, Ouk S, Moscvin M, Vitale N, Serra S, Arruga F, Zakrzewski JL, Liou HC, Allan JN, Furman RR, Deaglio S. Targeting metabolism and survival in chronic lymphocytic leukemia and Richter syndrome cells by a novel NF-κB inhibitor. Haematologica. 2017;102:1878-1889
82. Ho SN. Intracellular water homeostasis and the mammalian cellular osmotic stress response. J Cell Physiol. 2006;206:9-15
83. Morandi A, Indraccolo S. Linking metabolic reprogramming to therapy resistance in cancer. Biochem Biophys Acta. 2017;1868:1-6
84. Oei AL, Vriend LE, Crezee J, Franken NA, Krawczyk PM. Effects of hyperthermia on DNA repair pathways: one treatment to inhibit them all. Radiat Oncol. 2015;10:165
85. Azzam EI, Jay-Gerin JP, Pain D. Ionizing radiation-induced metabolic oxidative stress and prolonged cell injury. Cancer Lett. 2012;327:48-60
Author contact
![]() Corresponding author: dominique.plotonfr
Corresponding author: dominique.plotonfr