- Volume 10; 2026
- Volume 9; 2025
- Volume 8; 2024
- Volume 7; 2023
- Volume 6; 2022
- Archive
- Editorial Board
- Cover Suggestion
- Index & Coverage
- Special Issues
Introduction
Results and Discussion
Conclusion
Materials and Methods
Abbreviations
Acknowledgements
References
International Journal of Biological Sciences
International Journal of Medical Sciences

 Global reach, higher impact
Nanotheranostics 2021; 5(2):240-255. doi:10.7150/ntno.50721 This issue Cite
Research Paper
Non-radioactive and sensitive tracking of neutrophils towards inflammation using antibody functionalized magnetic particle imaging tracers
Prashant Chandrasekharan1* ![]() , K.L. Barry Fung1,2 *
, K.L. Barry Fung1,2 * ![]() , Xinyi Y. Zhou1,2*, Weiwen Cui1, Caylin Colson1,2, David Mai1, Kenneth Jeffris1, Quincy Huynh3, Chinmoy Saayujya3, Leyla Kabuli1, Benjamin Fellows1, Yao Lu1, Elaine Yu1, Zhi Wei Tay1, Bo Zheng1, Lawrence Fong4, Steven M. Conolly1,3
, Xinyi Y. Zhou1,2*, Weiwen Cui1, Caylin Colson1,2, David Mai1, Kenneth Jeffris1, Quincy Huynh3, Chinmoy Saayujya3, Leyla Kabuli1, Benjamin Fellows1, Yao Lu1, Elaine Yu1, Zhi Wei Tay1, Bo Zheng1, Lawrence Fong4, Steven M. Conolly1,3
1. Department of Bioengineering, University of California, Berkeley, California 94720, United States.
2. UC Berkeley-UCSF Graduate Group in Bioengineering, California, United States.
3. Department of Electrical Engineering and Computer Sciences, University of California, Berkeley, California 94720, United States.
4. UCSF Helen Diller Family Comprehensive Cancer Center, University of California, San Francisco, California 94143, United States.
*These authors contributed equally to this work.
Received 2020-7-19; Accepted 2021-1-14; Published 2021-2-12
Abstract

White blood cells (WBCs) are a key component of the mammalian immune system and play an essential role in surveillance, defense, and adaptation against foreign pathogens. Apart from their roles in the active combat of infection and the development of adaptive immunity, immune cells are also involved in tumor development and metastasis. Antibody-based therapeutics have been developed to regulate (i.e. selectively activate or inhibit immune function) and harness immune cells to fight malignancy. Alternatively, non-invasive tracking of WBC distribution can diagnose inflammation, infection, fevers of unknown origin (FUOs), and cancer. Magnetic Particle Imaging (MPI) is a non-invasive, non-radioactive, and sensitive medical imaging technique that uses safe superparamagnetic iron oxide nanoparticles (SPIOs) as tracers. MPI has previously been shown to track therapeutic stem cells for over 87 days with a ~200 cell detection limit. In the current work, we utilized antibody-conjugated SPIOs specific to neutrophils for in situ labeling, and non-invasive and radiation-free tracking of these inflammatory cells to sites of infection and inflammation in an in vivo murine model of lipopolysaccharide-induced myositis. MPI showed sensitive detection of inflammation with a contrast-to-noise ratio of ~8-13.
Keywords: magnetic particle imaging, white blood cells, antibody, medical imaging, inflammation, superparamagnetic iron oxide nanoparticles
Introduction
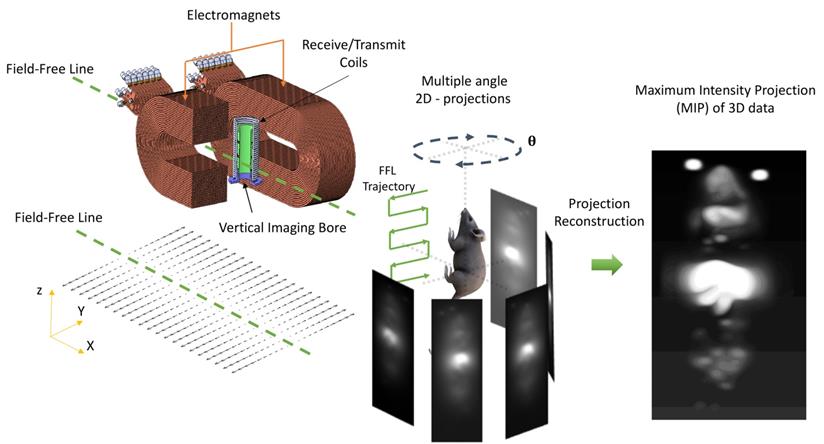
Magnetic particle imaging (MPI) is an emerging non-invasive tracer imaging modality that images superparamagnetic iron oxide nanoparticle tracers (SPIOs) using their non-linear magnetization response (see Figure 1). The safety profile of the MPI tracer makes it suitable for use even in pediatric patients and those suffering with chronic kidney disease. Long-circulating MPI tracers facilitate imaging of the circulatory system and provide valuable information on pathologies associated with vascular defects such as in cancer [1], lower gastrointestinal abdominal bleed [2], stroke [3], traumatic brain injury [4], and diseases involving lung ventilation and perfusion [5, 6]. MPI also allows for the monitoring of chemotherapy [7]. Because the SPIO tracer in MPI generates high contrast images with long persistence [8], interest in MPI cell tracking has grown, especially for assessing the fate of cell-based therapeutics such as stem cell therapies and immune cell therapies [9-14].
Magnetic Particle Imaging using a custom-built vertical bore 6.3 T/m Field- Free Line (FFL) scanner. The MPI scanner allows for 2D projection and 3D tomographic imaging of the spatial distribution of superparamagnetic iron oxide nanoparticles tracers (SPIOs). SPIOs obey Langevin physics; there is high magnetic saturation in response to an applied field and zero coercivity or remanence once the field is removed. In MPI, a time- varying field is applied and only the particles at the FFL flip in response. The flip generates a signal in a receiver coil due to Faraday's law of induction, and rastering the FFL allows the signal to be spatially localized. The FFL scanner can acquire a single 2D projection, or multiple 2D projections at various angles. Classical projection reconstruction algorithms can be implemented to reconstruct 3D MPI images from 2D projections. (2D: two-dimension; 3D: three-dimension; FFL: field-free line; MIP: maximum intensity projection; SPIO: superparamagnetic iron oxide nanoparticles).
MPI signal is known to be highly sensitive and linearly quantitative, including when other entities of interest, such as cells, are attached to SPIOs. Notably, a detection sensitivity of ~200 cells was reported in one of the seminal cell tracking studies using MPI [15].The signal from MPI tracers does not decay over time and persists until the tracer is biochemically hydrolyzed. This has allowed for MPI studies that track SPIO-labeled stem cells for over ~87 days to monitor the long-term fate of therapeutic cells [15, 16]. The combination of exceptional sensitivity and capacity for long-term imaging is why MPI is particularly well-suited to tracking cell therapeutics, in which cells are known to persist for months or even years [17-19]. MPI has also been used to probe for visceral surgical sites, for functional grafting of islet cells in a preclinical model [20], and for monitoring successful islet cellular graft implantation and insulin production. MPI also has a superior dose limited-sensitivity - in a recent study, 2D MPI projection scans using a clinically relevant dose of 5 mg of Fe/kg (as was used in this work) were sufficient to detect GI bleed with rates as low as 1 and 5 µl/min [2].
The role of immune cells has been implicated in the onset of various pathologies and the inflammatory process has thus been observed during the early stages of infection, cancer, and neurodegenerative diseases [18], [21-23]. The tracking of immune cells and their responses are thus invaluable for early diagnosis of such pathologies.
There are a number of approaches for imaging inflammation and infection [24]. Anatomical imaging methods are used in monitoring morphological changes in organs, especially in bones, tendons, muscles, and certain soft tissues. X-ray Computed Tomography (CT) and magnetic resonance imaging (MRI) are often used for detecting changes in bones, tendons, and some soft tissues, while ultrasound is used for assessing the effects of infection and inflammation in dermal and soft tissue [24].
Functional imaging, using nuclear medicine techniques, allows for a more comprehensive diagnosis of functional tissue impairment due to infection and inflammation and provides a much earlier diagnosis before the morphology is altered. These methods detect the onset of inflammation, characterized by vessel dilation, changes to extracellular spaces, and most notably, increased accumulation of neutrophils and other phagocytic immune cells (e.g. monocytes and macrophages) [25, 26].
Neutrophils are the first responders in innate immunity (which forms the initial response of the body to infection), and their role is to kill the source of infection and modulate both the innate and adaptive immune response. Tracking neutrophils are therefore an ideal functional imaging method that would enable the early detection of inflammation.
Functional imaging often relies on tracer imaging modalities, which predominantly image the biochemistry of infection and inflammation. The Ga-67 tracer used in Gallium citrate scintigraphy, for instance, binds to transferrin receptors (CD71) that are highly expressed by inflammatory cells. Ga-67 is also known to bind directly to siderophore molecules of bacteria, enabling the direct visualization of the sites of infection [27, 28]. In another approach, In-111 tagged Somatostatin receptor (SSTR) binding analogues were used to identify granulomatous and chronic inflammation that had an over-expression of SSTR [29, 30]. Recently, inflammation-associated enzymatically responsive MPI tracer was developed to image vulnerable atherosclerotic plaque [31].
Direct labeling and tracking of immune cells with tracers is another option for tracking inflammation and infection. White blood cell (WBC) tracking traditionally refers to the clinical method utilizing scintigraphy or single photon emission computed tomography for diagnosis of inflammation and infection, and is often called for in cases of fever of unknown origin (FUO) [32, 33]. WBC tracking is achieved by either ex vivo tracer labeling of immune cells (isolated from a blood draw) which are re-introduced via intravenous injection (i.v.), or by in situ tracer labeling of immune cells. Ex vivo labeling of cells can be achieved chemically by precipitating the tracer within the immune cells of interest [34, 35] or biologically by allowing the isolated immune cells to phagocytose the tracer [36-38]. Recently, new and exciting approaches for ex vivo labeling and tracking of therapeutic T-cells [39] and macrophages [40, 41] using MPI have also been reported.
While ex vivo labeling of tracers is well established and commonly done clinically, the technique is rather elaborate and requires long preparation times and expertise. In comparison, in situ cell labeling is performed by injecting the tracer directly into the subject and utilizing innate tracer properties and pathophysiology to provide specificity, and thus is a versatile approach that preserves labeled cell function and viability. Examples of this technique include using antibody-labeled tracers that target specific surface proteins expressed by granulocytes. For instance, antibodies that selectively bind to “non-specific cross-reacting antigen” 90 and 95 (NCA-90 and NCA-95) are being tagged with Tc99m or In-111 radioisotopes for scintigraphy [42].
Nano-sized colloids are also used in in situ labelling for imaging inflammation. Tc99m- albumin nanocolloids, Tc99m-sulfur colloids and iron oxide nanoparticles are readily taken up by the organs of the reticuloendothelial system (RES), including the liver, spleen, and bone marrow. The non-specific extravasation of the nano-colloids at sites of inflammation is considered the general mechanism of accumulation for these tracers [43]. Recent research points to a more specific mechanism in which i.v. administered nanocolloids are specifically taken up by polarized phagocytes in the RES system that then accumulate at sites of inflammation. This mechanism for imaging inflammation has been thoroughly vetted for MRI [44] by using different colloidal tracers of iron oxide nanoparticles [45-47], and 19F [48-50].
In the current work, we report an approach for in situ labeling and tracking of granulocytes/neutrophils to sites of lipopolysaccharide induced myositis using MPI. To achieve in situ labeling we selected an MPI tracer with surface antibodies of anti-Ly6G, which are specific towards surface antigens expressed on murine neutrophil immune cells. We characterized the MPI performance of these tracer using our home-built arbitrary wave relaxometer (AWR) [51] and scanner [2] and evaluated the specificity and sensitivity of these tracers in vitro. Finally, we demonstrated the in vivo homing of the labeled neutrophils to sites of myositis and validated the findings with histology.
Results and Discussion
MPI tracers for tracking WBCs
In the current work, we have utilized commercially available SPIO nanoparticles for tracking WBCs using MPI. Antibody-conjugated iron oxide nanoparticles (antibody-SPIOs) are extensively used to isolate a selective cell population from a mixed cell population [52]. Antibody-SPIOs that bind to specific cell surface markers of a cell population can be “pulled” using magnetic fields. This method has high specificity for isolating cells and preserves the overall functionality of the cells. We identified commercially available anti-Ly6G SPIOs that selectively tag Ly6G antigen expressed on murine neutrophils in situ and used VivoTraxTM as a control. The properties of VivoTraxTM and anti-Ly6G antibody bound tracer are summarized in Tables 1 & 2.
Physical and MPI properties of evaluated tracers
| Tracer Name | Core Size (nm) | DH# (nm) | PDI | Zeta (mV) | Resolution* (mm) | LoD† (ng of Fe) |
|---|---|---|---|---|---|---|
| Anti-Ly6G SPIO | 14.0 ± 2 | 78 | 0.097 | -12.2 ± 0.6 | 1.26 | 13 ± 1 |
| VivoTraxTM | 5.4 ± 1 | 61 | 0.223 | -12.7 ± 1.8 | 1.49 | 22 ± 3 |
*The measurements reported were carried out using an arbitrary wave relaxometer (AWR) and are converted for a 7 T/m gradient field-free-line MPI scanner operating at 20 mT and 20 kHz excitation.
†Calculations for the limit of detection (LoD) were based on a standard curve taken in the scanner (Figure 3, FOV = 4.1 x 6.2 cm2, scan time = 37 s) estimated for a pixel size of 1.4 × 1.4 mm2. Standard deviation is propagated from the error in the linear fitting of the curve.
#Hydrodynamic diameter and zeta potential measured using Nano Zetasizer
(DH: Hydrodynamic diameter; FOV: field-of-view; LoD: Limit of detection; PDI: polydispersity index).
Magnetic characteristics of evaluated tracers
| Tracer Name | Msat# (emu/g Fe) | <Hsat>† (mT) | Dv* (nm) | σln d* (unitless, logscale) |
|---|---|---|---|---|
| Anti-Ly6G SPIO | 44 ± 3 | 4.4 | 14.8 | 0.5 |
| VivoTraxTM | 131 ± 1 | 5.2 | 9.8 | 0.2 |
# At ±1 T, Lake Shore Cryotronics 7400 series Vibrating Sample Magnetometer.
†Value derived from the full width at half maximum (FWHM) of the point spread function of the particle in an Arbitrary Wave Relaxometer.
* Mean values derived from fit of M(H) curve to the ensemble Langevin from a log-normal distribution of spherical magnetite particles at 290 K
(Dv: mean magnetic diameter; Hsat: saturating field; FWHM: full width at half maximum; Msat: saturation magnetization; mT: milli-tesla; nm: nanometer).
Both VivoTraxTM and anti-Ly6G SPIOs are synthesized by the co-precipitation of iron salts under a reducing environment, in a similar manner to numerous other iron nanoparticle supplements [53], and have a carboxydextran coating for colloidal stabilization in physiological fluids [52-54]. VivoTraxTM is a carboxydextran cross-linked clustered iron oxide nanoparticle with an average core diameter of 5.4 nm and a hydrodynamic diameter of 61 nm. The anti-Ly6G SPIO is coated with dextran and functionalized with IgG1 monoclonal antibody, and also appeared clustered under transmission electron microscopy (TEM). They had an average core diameter of 14 nm and a hydrodynamic diameter of 78 nm. Figure 2 shows the TEM images, magnetic response, and MPI response of the tracers used in this study. Both VivoTraxTM and the anti-Ly6G- SPIOs were superparamagnetic based on the M-H curve measured using a vibrating sample magnetometer (VSM). Notably, the anti-Ly6G-SPIO had a smaller Msat, but a larger initial susceptibility ( ) compared to VivoTraxTM [55, 56]. The magnetic diameter and distribution were estimated by fitting the data to the ensemble Langevin response from a log-normal distribution of particles (akin to Chantrell's method) [57, 58]. The non-linear least squares estimate for the magnetic diameter of the anti-Ly6G-SPIOs and VivoTraxTM were 14.8 nm (σln d = 0.5) and 9.8 nm (σln d = 0.2) respectively, showing good correspondence to the physical size estimate from TEM.
Magnetic characterization of the anti-Ly6G SPIOs compared to VivoTraxTM (VT). Representative transmission electron microscopy (TEM) images (scale bar = 50 nm) were taken of both (A) VT with core diameter = 5.4 ± 1 nm and (B) anti-Ly6G SPIOs with core diameter = 14 ± 2 nm. (C) The magnetization curve of VT and the anti-Ly6G SPIOs as measured in a VSM were fit to a log-normal diameter distribution. Anti-Ly6G SPIOs had a mean magnetic diameter (Dv) of 14.8 nm, with a log-normal standard deviation (σln d) of 0.5. VT had (Dv) = 9.8 nm and σ = 0.2. We used a custom arbitrary waveform relaxometer (AWR) to measure the MPI point spread function (PSF) of both samples in saline and in blood. Representative PSFs are shown in (D) for VT and (E) for the anti-Ly6G SPIOs. Note the signal change in the PSF of VT, with the change in signal being significant (p < 0.05). In comparison, anti-Ly6G SPIOs showed stable behavior in both solvents (change in signal was not significant (p = 0.7 > 0.05). (F) A standard curve of MPI signal was taken versus iron concentration for all particles in mouse blood and in saline, with mean and standard error given over n = 3 samples (with 8 acquisition repeats averaged per sample). Both particles show linearity with concentration in both solvents (R2 > 0.99). The anti-Ly6G SPIOs showed significantly better resolution (p < 0.01) and sensitivity (1.8 ± 0.3 times better, with p < 0.01) than VivoTraxTM. VivoTraxTM showed a significant (p < 0.01) change in sensitivity (V/g) in different media, while the anti-Ly6G SPIOs did not (p > 0.05). This standard curve was also repeated in the scanner and is included in Figure 3. (H: magnetic field; M: Magnetization; MPI; magnetic particle imaging; PSF: point-spread function; SPIO: superparamagnetic iron oxide; VT: VivoTraxTM).
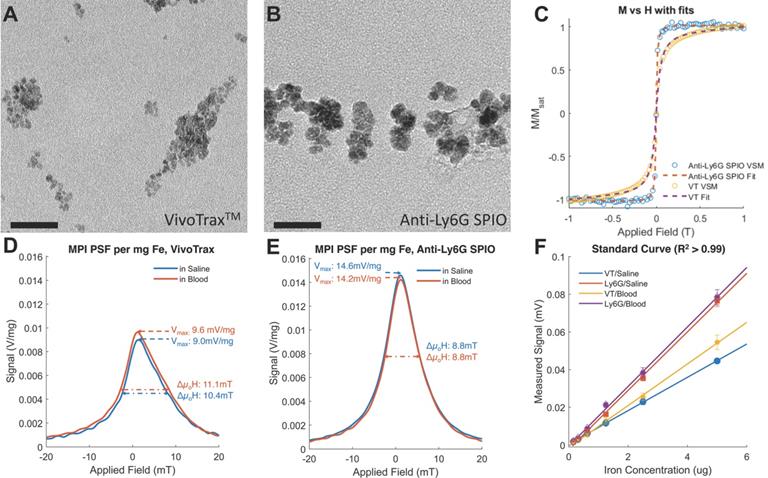
We further tested the MPI performance of VivoTraxTM and anti-Ly6G SPIOs using our home-built arbitrary wave relaxometer (AWR) [51] and our scanner [2] in whole murine blood and in 1X phosphate buffered saline (PBS) (Figures 2 and 3). As i.v. administered tracers first partition within the blood before distributing to different parts of the body, we wanted to examine whether the MPI tracer properties were influenced by the presence of blood. We observed a 1.8 ± 0.3 times higher MPI signal per gram of iron from anti-Ly6G SPIOs compared to VivoTraxTM in 1X PBS in the AWR (based on the slope of standard curve in Figure 2F), and a 1.7 ± 0.5 times relative signal for similar samples in the scanner (Figure 3). Moreover, the anti-Ly6G SPIO had a better MPI resolution, equivalent to 1.26 mm (or 8.8 mT) in a 7 T/m MPI field gradient, whereas VivoTraxTM had a resolution of 1.49 mm (or 10.4 mT). The better performance in MPI signal and resolution of the anti-Ly6G SPIO compared to VivoTraxTM can be explained through the Langevin behavior of the nanoparticle tracer. In MPI, the magnetization of SPIOs is controlled by a time-varying sinusoidal magnetic field (typically, with 20 mT amplitude at 20 kHz). The resultant MPI signal scales with the rate of change of magnetization  due to Faraday's law [59]. The improved MPI signal for anti-Ly6G SPIOs as compared to VivoTraxTM can thus be attributed to its higher susceptibility near zero applied field (Figure 2C), which in turn may be explained by the anti-Ly6G SPIOs' larger magnetic core (Dv in Table 2). The resolution of the MPI tracer depends on the width of the transition from positive to negative saturation (2Hsat), which scales proportionally to
  where d is the diameter of the nanoparticles. The larger core size of the anti-Ly6G SPIOs could thus explain the significant gain in resolution.
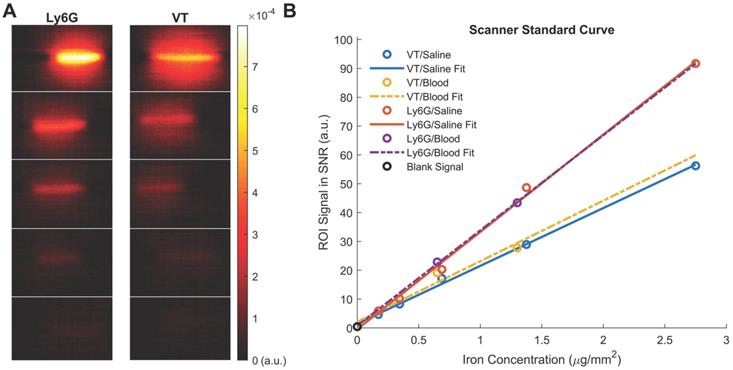
Standard Curve of the anti-Ly6G SPIOs and VivoTraxTM (VT) in our Field-Free Line Scanner. (A) the images of the standard curve for anti-Ly6G SPIOs and VT in saline are shown in linear heat scale scaled to the maximum signal between both curves (FOV = 4.1 x 6.2 cm2, scan time = 37s). Note the increased conspicuity of anti-Ly6G SPIOs when compared to VivoTraxTM (B) The standard curves in saline (given as the sample SNR averaged from the 5 pixels by 5 pixels center of each sample), alongside standard curves in blood. The linear fits to each particle and solvent pair are mostly good (R2 > 0.99), except for VT in blood (R2 = 0.85) - this can be attributed to experimental error in the sample at 0.7 μg mm-2. Note the similarity to Figure 2F, with the sensitivity of the anti-Ly6G SPIOs being 1.7 ± 0.5 times better than that of VivoTraxTM. (SNR: signal-to-noise ratio; SPIO: superparamagnetic iron oxide; VT: VivoTraxTM).
We also observed that the peak signal of VivoTraxTM (Figures 2D & F) in 1X PBS was different compared to its properties in whole blood. In contrast, the properties of anti-Ly6G SPIOs remained the same (Figures 2E & F). The change in behavior arises from the particle interaction with the blood sample. Note that the particles are well suspended as colloids, so there is minimal interparticle interaction. The anti-Ly6G SPIOs interact with specific cell surface antigens (as shown in Figures 4A-D), while carboxydextran-coated SPIO particles such as VivoTraxTM are phagocytosed by the blood cells and aggregated within endocytic vesicles [37]. A dipole-dipole interaction within the vesicles could alter the effective susceptibility  due to change in fractional volume of the particles. These subtle changes observed using the AWR were less pronounced in the standard curve taken in the scanner (Figure 3B). This could be due to inherent differences in sensitivity between a 1D-arbitrary wave relaxometer versus an image scanner, experimental errors, as well as the effects of relaxation induced blurring on a non-point source phantom [51, 59, 60]. Signal changes observed using VivoTraxTM in AWR are being evaluated for use with pulsed and color MPI for studying the influence of micro-environment on the particles [51,61-64]. We ourselves have observed similar changes in our previous publication with VivoTraxTM labeled stem cells and believe that these observations warrant further investigation [15]. In either case, the invariability in media and improved resolution of the commercially available anti-Ly6G SPIOs used for magnetic cell sorting make them competitive for MPI imaging.
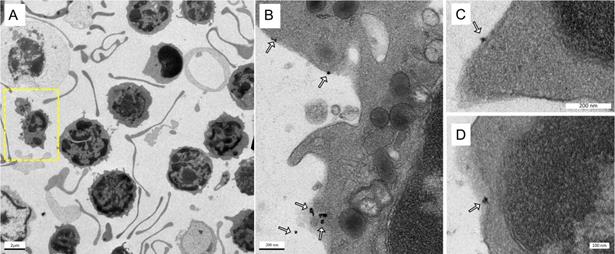
Labeling of immune cells using anti-Ly6G SPIOs. (A) TEM images of whole blood sample incubated with anti-Ly6G SPIOs (scale bar = 2 μm). (B), (C) Magnified TEM images (scale bar = 200 nm) & (D) (scale bar = 100 nm) of yellow box marked in (A). The arrows point to the blood cell-membrane bound nanoparticles. The membrane bound particles had a core diameter of 16 ± 5 nm, corresponding well with the size of anti-Ly6G SPIO particles observed in Figure 2 (SPIO: superparamagnetic iron oxide (nanoparticles); TEM: transmission electron microscopy).
Cell Enrichment Analysis of MPI Tracers
Next, we assessed the binding and enrichment efficiency of the MPI tracers to neutrophils using two methods, a qualitative assessment using TEM (Figure 4) and a quantitative approach using flow cytometry (Figure 11). Note that the proportions of cell types in healthy human and mouse blood are different; for example, a healthy human has 50-70% peripheral blood neutrophils [65] compared to only 20-30% neutrophils in murine subjects [66]. Here, we tested the enrichment efficiency of the anti-Ly6G SPIO tracer in selectively binding and enriching the WBC of interest (i.e. neutrophils, which form the largest subset of granulocytes). The anti-Ly6G antibody is a monoclonal IgG antibody with a high binding specificity towards the antigen or an epitope (antigen binding site), with a binding constant typically in the order of nMs [67].
Figures 4A-D show the TEM images of anti-Ly6G SPIOs incubated in murine whole blood sample. Of the various WBC cell populations found in the sample, only a few cells were found to be tagged with anti-Ly6G SPIOs. The anti-Ly6G SPIOs were predominantly membrane bound and were not found in the cytoplasm of the immune cells. The core diameter of the particles in the TEM were 16 ± 5 nm and corresponded well in size with the TEM of particles in Figure 2. Furthermore, the particle distribution in the fixed sample in Figure 4 corroborates well with previously published research articles [68, 69]. Using flow cytometry, we then evaluated differential population enrichment of WBCs using three SPIOs: (1) anti-Ly6G SPIOs, (2) anti-F4/80 SPIOs and (3) VivoTraxTM.
The RBC-lysed blood samples were incubated with the SPIOs and run through a magnetic column once [52]. Two populations were recovered from this column: the “eluate” of cells collected from the column under a magnetic field (i.e. cells not bound to SPIOs that can be eluted through the column) and the remaining cells recovered from the “column” (i.e. after the initial eluate is recovered & the magnetic field is removed so that cells bound to SPIOs can be recovered). The “eluate” and “column” were analyzed using flow cytometry to determine the number of granulocytes and CD11b+ & Ly6G+ cell types relative to the total number of cells. Granulocytes and CD11b+ & Ly6G+ from untouched RBC-lysed blood samples served as a control providing a gauge of initial % immune cell population in the blood. Figure 5 shows the % total counts of granulocytes and CD11b+ & Ly6G+ WBCs from the “eluate” and “column” with relation to the control for each SPIO used. It should be noted that neutrophils are the largest subset of granulocytes, followed by eosinophils and basophils. Eosinophils are found to vary between 0-7% of total mouse WBCs, while basophils are almost negligible in mouse blood [66]. Eosinophils do exhibit a varying lower expression of Ly6G marker on the cell surface [70]. As such, gating the granulocyte population utilizing forward and side scattering profiles provides an upper bound to the neutrophil population, while counting the number of cells with CD11b+ & Ly6G+ gating provides a more specific estimate of neutrophils. As such, we evaluated the degree of enrichment of both granulocytes and neutrophils (i.e. CD11b+ & Ly6G+ cells) in the “column” for each SPIO under investigation relative to the degree of depletion of the same population in the “eluate”.
Cell enrichment analysis of MPI tracers using flow cytometry: Flow cytometry data represented as % enriched immune cell population (normalized to total cells counted) in the “Eluate” and “Column” content collected during and after magnetic separation of RBC lysed mouse blood using anti-Ly6G SPIOs, anti-F4/80 SPIOs and VivoTraxTM. The control data represents the % of immune cells of interest (normalized to total cells counted) in unseparated RBC lysed blood samples. We were particularly interested in the granulocyte population (of which neutrophils are the largest subset) and the CD11b+ & Ly6G+ population. A significant enrichment of both granulocyte population and CD11b+ & Ly6G+ was observed in the “Column” using anti-Ly6G SPIOs. Anti-F4/80 SPIOs showed no enrichment of granulocytes or neutrophil population, which is expected due to lack of specificity to those populations. Finally, VivotraxTM showed significant enrichment of both granulocytes and neutrophil population (P<0.05 (**) and P<0.001 (***)) but the percentage relative enrichment in the “column” was not significant with respect to control (P> 0.05) (MPI: magnetic particle imaging; RBC: red blood cells; SPIO: superparamagnetic iron oxide).
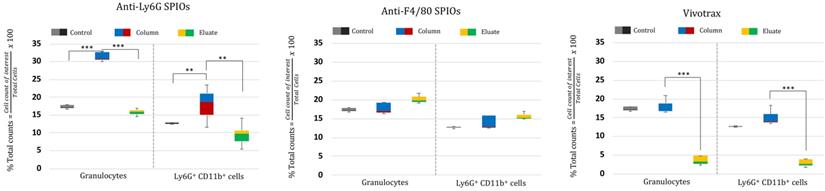
The anti-Ly6G SPIOs showed significant enrichment of both the granulocyte population and the CD11b+ & Ly6G+ population in the “column” relative to the “eluate”. In comparison, anti-F4/80 SPIOs did not show enrichment of the granulocyte or neutrophil (CD11b+ & Ly6G+) population (eluate vs. column in comparison to the control). F4/80 is a marker of tissue residual monocytes/macrophages and is sparingly expressed in circulating WBCs [71, 72]. It is thus important that we did not notice enrichment of circulating granulocytes/neutrophils populations with anti-F4/80 SPIOs. Finally, VivoTraxTM showed significant change in the granulocyte (& neutrophil) population in the “column” compared to “eluate”. However, the relative population of granulocyte (& neutrophil) in “column” was similar to that of control.
Combined, the populations in “column” vs “eluate” for VivoTraxTM appear to indicate that the incubation resulted in the labeling of all WBC subtypes, as shown in the overall reduction in the WBC cell counts in the eluate from the magnetic column (Figure 5, VivoTraxTM Column vs. Eluate with respect to control). Though we did not acquire a TEM image of VivoTraxTM equivalent to that in Figure 4, there is a plethora of literature that has demonstrated that dextran-coated SPIOs are phagocytosed and internalized by peripheral blood cells [37, 46, 73-76]. In fact, it was previously shown that i.v. administered VivoTraxTM is quickly taken up by the phagocytic cells of the RES system [54], that are distributed predominantly in the liver.
In vivo evaluation of tracers
We evaluated the tracer biodistribution in a healthy mouse and a mouse model of myositis of the right thigh muscle induced by bacterial lipopolysaccharides (LPS). For in vivo evaluation we investigated the distributions of anti-Ly6G SPIOs and VivoTraxTM in mice. LPS derived from gram negative bacteria are known to cause localized inflammation with systemic elevation of circulating inflammatory blood cell count [77]. Neutrophils are the first responders to inflammation and infection and are followed by a slow migration of monocytes that differentiate into mature macrophages, thus providing a suitable target for imaging acute inflammation.
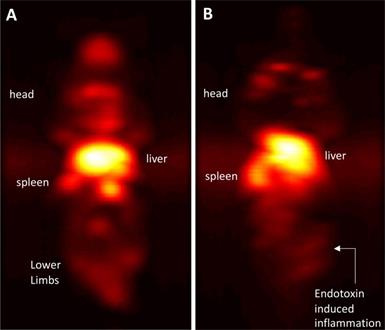
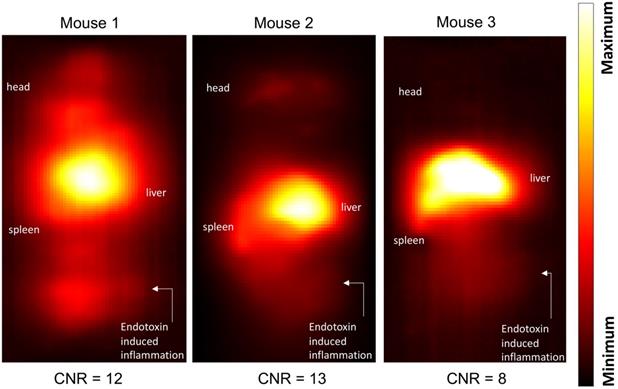
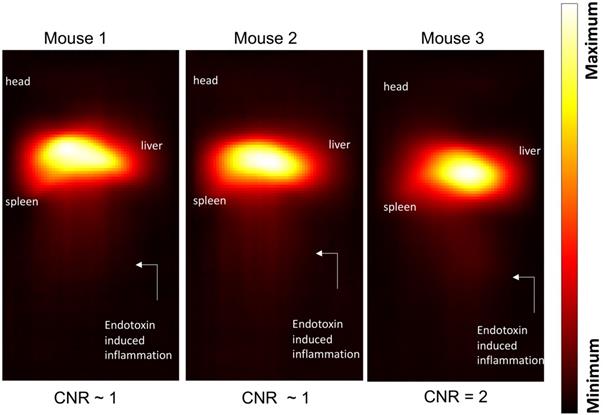
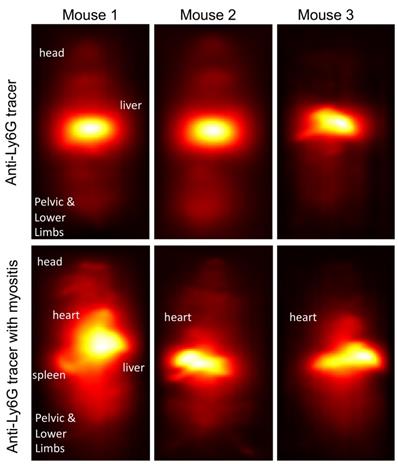
Maximum-intensity projections (MIP) of 3D MPI images 24 hours post anti-Ly6G SPIO administration are shown in Figure 6. 2D-projection MPI images in three different mice with LPS-induced myositis, and with i.v. injections of anti-Ly6G SPIO are shown in Figure 7. Figure 8 shows 2D-projection MPI images of three different mice that with LPS-induced myositis, and with i.v. injections of VivoTraxTM. Contrast-to-noise ratio (CNR) was calculated for each 2D projection by comparing the ROI of the inflamed (i.e. right) flank as compared to the contralateral (i.e. left) flank versus the background noise extracted from the upper left background in each image.
Immuno-MPI: Anterior-posterior maximum intensity projection (MIP) images of 3D MPI data, 24 hours post anti-Ly6G antibody SPIO tracer administration in (A) a healthy mouse (B) mouse with LPS endotoxin induced myositis in the right leg (MIP: maximum intensity projection; MPI: magnetic particle imaging; SPIO: superparamagnetic iron oxide).
Inflammation images in three different mouse subjects with myositis and i.v. administered anti-Ly6G-SPIO. Mouse 1 had a cardio-pulmonary reaction to the tracer and the experiment had to be terminated early (1-hour post tracer administration), while Mouse 2 and Mouse 3 were acquired at 24 hours post tracer administration. The CNR of the site of inflammation was between 8-13 (CNR: contrast-to-noise ratio; SPIO: superparamagnetic iron oxide).
Inflammation images in three different mouse subjects with myositis and using VivoTraxTM as tracer. At a dose of 5 mg of Fe/kg the CNR was ~1-2 at the site of myositis acquired 24 hours post-tracer administration (CNR: contrast-to-noise ratio).
In healthy mice, anti-Ly6G SPIOs rapidly distributed in the RES organs of liver and spleen, and more notably, in the marrows of cranium, limbs and the pelvic bones (Figure 6A & Figure 9 top row). In mice with LPS-induced myositis, the circulation times of i.v. injected anti-Ly6G SPIO increased, as observed by prominent signal from the ventricle of the heart (see Figure 9 bottom row). 24 hours after tracer administration, CNRs between 8 and 13 were observed on the inflamed right thigh of anti-Ly6G SPIO administered mice (Figure 6B & 7) as compared to the non-inflamed left thigh.
Change in circulation times of tracer after inducing inflammation. In healthy mice (top row), anti-Ly6G SPIO tracer predominantly distributes in the organs of the RES including the liver, spleen, and bone marrow, at around 4-5 hours post-tracer administration. We observed a change in the circulation times of the tracer in myositis induced mice (bottom row). These mice showed prominent MPI signal from the ventricles of the heart around 4-5 hours of post-tracer administration indicative of longer circulation times of tracer post inflammation (RES: reticuloendothelial system; SPIO: superparamagnetic iron oxide).
In comparison, i.v. administered VivoTraxTM, which is coated with carboxydextran, was quickly cleared by the RES system in the circulation and accumulated largely in the liver and to a small extent in the spleen in healthy mice and even in the mice with LPS-induced myositis (Figure 8). This data is in strong agreement with our previous observations [54].
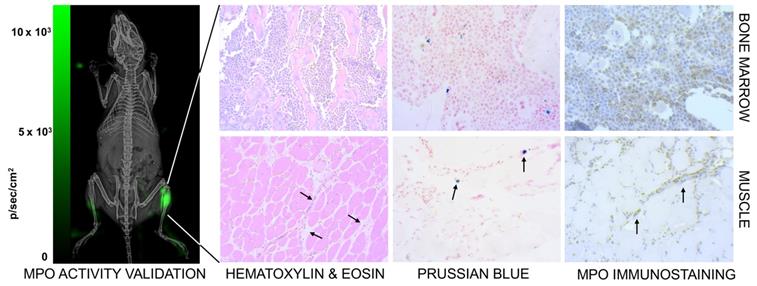
We co-validated the MPI images by checking for neutrophil presence using luminol, which is known to luminesce due to neutrophil associated myeloperoxidase activity [78]. Figure 10 (left) shows higher bioluminescence from the site of myositis on the right thigh. Further, tissue histology from the inflamed tissue confirmed the localization of anti-Ly6G labeled neutrophils at the site of inflammation, as seen in Figure 10 (right).
Confirmation of inflammation. (Left) The neutrophil activity at the site of myositis was confirmed by using i.p. administered luminol, which provides bioluminescent visualization of myeloperoxidase (MPO) enzyme activity. (Right) Histological analysis of anti-Ly6G nanoparticle uptake in mouse models. Images were captured by brightfield microscopy following staining of infected tissues using H&E staining for tissue morphology, Prussian blue staining for SPIO, and immunohistochemistry for myeloperoxidase. The Prussian blue confirmed the distribution of anti-Ly6G SPIO in bone marrow in regions with increased MPO enzyme expression (myeloid cells). The images shown in the bottom row are muscle tissues from the right infected leg. Inflammation injury was observed in the H&E stain (arrows), with the corresponding regions showing areas of increased iron and MPO enzyme activity (H&E: hematoxylin & eosin; MPO: myeloperoxidase; SPIO: superparamagnetic iron oxide (nanoparticles).
The observed difference in CNR for anti-Ly6G particles versus VivoTraxTM is well supported by existing literature. Intravenously administered nanoparticles in general are known to accumulate in the RES system, including the liver, spleen, and marrow. Combined Sulphur colloids and WBC scintigraphy have been used for diagnosis of osteomyelitis [26]. Ultrasmall superparamagnetic iron oxide nanoparticles (USPIOs) with long circulation time and in the size range of 5-15 nm exhibited bone marrow uptake [79]. However, colloids the size of VivoTraxTM had insignificant bone marrow uptake.
Marrows are active centers of the hematopoietic system and have a large pool of myeloid cells expressing Ly6G markers. Imaging with anti-Ly6G SPIOs enabled a marked improvement in contrast of the bone marrow, as seen in Figure 6A & 9 (top row). We attribute this to the antibody binding to the specific cell lineages of the marrow cells, which was also confirmed by Prussian blue staining in the areas of myeloid cells (Figure 10).
When considering the clinical implications of this study, we note that physiological differences do exist between murine models and humans. Under healthy conditions only ~20% of circulating blood cells are neutrophils in mouse, whereas almost ~70% of the circulating white blood cells are neutrophils in humans.
The number of circulating peripheral blood neutrophils in both species does increase at the onset of inflammation [80], which helps explain the increase in circulation time of the administered tracers in inflamed mice. Similar observations were reported with MRI imaging using IgG antibody-SPIO administered in rodents [81]. Though that work was done with a polyclonal IgG, with our monoclonal IgG we observed a marked difference in specificity of the administered tracer in terms of their in vitro binding and in vivo biodistribution with anti-Ly6G SPIO. More detailed work further examining WBC dynamics with different antibody-based SPIOs specific to a greater variety of immune cell such as that of anti-F4/80 SPIOs, will complement this study in the future [44, 82].
Conclusion
In this work, we harnessed monoclonal antibodies for in situ labeling and tracking of neutrophils using MPI. Commercially available libraries of anti-Ly6G SPIOs showed better MPI performance in terms of both signal-to-noise ratio, resolution, and specificity of binding to neutrophils, than the most common MPI tracer, VivoTraxTM. In situ labeled neutrophils showed superior contrast in distinguishing sites of LPS induced myositis. In situ tagging of immune cells with anti-Ly6G SPIOs have several advantages compared to ex vivo labelling (1) in situ labelling reduces the overall preparation time of the study: currently, a clinical WBC study may entail isolating WBCs, ex vivo labeling, quality analysis and then tracer administration, and (2) in situ labelling reduces the burden on the labeled immune cells: ex vivo labeling of immune cells with SPIOs has shown to induce phenotypic changes in the cells [37], and to inhibit proliferation [83]. Despite these advantages, several aspects must be considered with the in situ labeling approach for tracking WBCs. There are likely to be differences in biodistribution as a result of non-specific tracer binding. Delayed MPI scans for diagnosis, approaches similar to the ones carried out using the clinical In-111 WBC scan, can enable higher specificity as a higher concentration of tracer-labeled cells is expected to accumulate at the site of inflammation over time. Additionally, anaphylactic reactions associated with administering antibodies are a risk. Monoclonal antibodies raised and produced in one organism, when administered to another organism, can result in the production of antibodies against the monoclonal antibody, leading to a toxic response [84, 85]. Additionally, mouse models of inflammation using LPS can develop platelet-activating factor (PAF)-mediated anaphylaxis-like shock when the immune cells are stimulated using the administered antibodies [86], resulting in respiratory distress and even death. One approach to mitigate anaphylaxis is to administer antibodies 24-hours post inducing inflammation. Another approach is to engineer antibodies that have negligible Fc receptor binding, which can reduce stimulation of the immune cells. For instance, antibodies with the Fc regions functionalized to a fluorochrome or nanoparticle can significantly mitigate secondary responses [87]. Note that monoclonal antibodies are commonly administered to patients as therapeutics, and potential side effects and mitigation strategies are well-understood in humans [88-92].
In summary, we developed a proof-of-concept in vivo approach to label and track neutrophils using MPI. This approach used SPIOs conjugated to anti-Ly6G-antibody, which is specific to Ly6G antigen, a Ly6 family of glycosylphosphatidylinositol-linked proteins. Ly6 proteins have been implicated in neutrophil migration and recruitment, and anti-Ly6 antibodies have previously been administered at high concentrations in mouse studies to deplete neutrophils from circulation [93]. Moreover, fluorescent probe conjugated antibodies against Ly6 have been used for tracking neutrophils using optical methods [87]. We adapted these methods to use anti-Ly6G-conjugated SPIOs to label and track neutrophils in vivo using MPI and demonstrated that this method could visualize neutrophil recruitment to inflammation in a mouse model of LPS-induced myositis. Additionally, we characterized commercially available antibody conjugated SPIOs manufactured for cell separation applications and showed that these SPIOs have better MPI performance than a traditional MPI tracer, VivoTraxTM. Notably, these antibody conjugated SPIOs had better signal and resolution for MPI applications, and higher specificity of binding to neutrophils. Future work using engineered antibodies conjugated to MPI tracer particles will open new avenues for tracking an even larger variety of cell types, with improved specificity and safety profiles. This approach represents a potential alternative to traditional radioactive tracers for tracking WBCs, which can impact the labeled cell phenotype and cause chromosomal aberrations [94, 95]. In the future, non-radioactive WBC tracking approaches using MPI and antibody-conjugated SPIOs may be an invaluable tool not only for imaging of inflammation, but also for optimizing and evaluating antibody-based and cell-based immunotherapies.
Materials and Methods
In all studies, anti-Ly6G-antibody functionalized SPIOs targeting surface antigens expressed in neutrophils were evaluated with VivoTraxTM as a control. Antibody-conjugated SPIOs were purchased from Miltenyi Biotec GmBH. Anti-F4/80 antibody functionalized SPIOs, specific to surface antigens that are expressed in the tissue residual monocytes, was used as a negative control only for the in vitro experiments.
The Miltenyi Biotech beads are particularly useful for MPI, as their superparamagnetic nature (i.e. having zero remanence and high initial susceptibility) resulted in better image resolution and signal than paramagnetic or ferromagnetic equivalents. 1 mL of Ultrapure microbeads of anti-Ly6G REA254.6 IgG1 clone (#130-120-337), and anti-F4/80 IgG1 clone (#130-110-443) were dialyzed before use against sterile 1X phosphate buffered saline overnight with two changes of solvent using a Spectra-Por® Float-A-Lyzer® G2 (MWCO 3.5-5 kDa). The sample was recovered and used as such. The iron content of the particles were estimated colorimetrically using the Perls' Prussian blue reaction [96]. In brief, 10 µL of particle sample was mixed with 100 μL of 1.2 mM hydrochloric acid solution (Sigma Aldrich Catalog No. HT202-250 ml) in 96 well black plate with transparent bottom. After 24-hour incubation, 100 µL of 4% w/v potassium ferrocyanide solution was added and incubated at room temperature for thirty-minutes before reading for absorbance at λ = 630 nm using a microplate reader (SpectraMax® i3, Molecular Devices). A standard curve was generated using serial dilution of iron ICP standard (TraceCERT®, Sigma Aldrich (56209)) followed by Perls' Prussian blue assay.
The protein quantification was carried out using classical Comassie Blue (Bradford) protein assay [97]. Bright field TEM was performed at 200 keV (Tecnai 12, FEI) to characterize nanoparticle morphology and size. Particle core diameter was calculated from the TEM image using ImageJ software. Hydrodynamic size and Zeta potential of the coated nanoparticles was measured in PBS using Dynamic Light Scattering (DLS, Malvern ZetaSizer Nano ZS). The DC magnetic properties of the particles in solution were measured by Vibrating Sample Magnetometer (7400 Series VSM, Lake Shore Cryotronics, Inc.). Magnetic size was determined by the fitting of M(H) data to a Langevin function assuming a log-normal size distribution (akin to Chantrell's method [58, 98]). Specifically, a non-linear least squares fit of the M(H) data was performed to a sum of moments generated by a log-normal distribution of particles with mean diameter Dv in nm and log-normal standard deviation  (unitless), with n = 100 logarithmically spaced bins on the interval 3 log-normal standard deviations above and below the mean (i.e.
 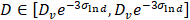 ). Particles were characterized for MPI performance using our in-house arbitrary wave relaxometer (AWR). The point-spread function and signal were estimated using a DC bias field sweep from -60 mT to 60 mT over 0.3 s and an excitation sinusoidal field of 20 kHz and 20 mT. Each sample was measured 8 times and averaged and had a measurement bin size of 0.1 mT. The characterization for each tracer was performed for 6 serially diluted 40 µl samples with concentration between 0.004-0.125 mg Fe/ml in 1X sterile phosphate buffered saline and in mouse blood (CD-1). Mouse blood was purchased from Lampire Biological Laboratories, Pipersville, PA. Blood was collected and stored in Na-Heparin and was used within two weeks from receiving. For MPI scanner sensitivity, the SPIO tracers were serially diluted from 2.75 - 0.172 mg of Fe/ml in 10 µl tubes in 1X PBS similar to our previous work [2]. For blood samples, only the higher Fe concentrations of 1.38 and 0.69 mg of Fe/ml of SPIOs were prepared (as above) in 10µl tubes. 2D-projection MPI scans were acquired with FOV = 4.1 x 6.2 cm2, data acquisition time of 37 s, and pixel size = 0.48 x 0.21 mm2. The standard curve was then plotted using the average SNR (using the 5 x 5 pixel surrounding the peak). Signal-to-noise ratio (SNR) was estimated as mean of signal over background noise (σ) extracted from the upper left background in each image for each sample. The linear fit of the standard curve for each particle provided the sensitivity in SNR per g Fe/mm2, and the limit of detection was then calculated for SNR = 3, with standard deviation derived from the standard deviation in the fit's coefficients.
Cell Enrichment Analysis of MPI Tracers
To evaluate cell enrichment and to evaluate labeling of neutrophils using antibody based MPI tracer, a qualitative analysis was carried out using transmission electron microscopy. A whole blood sample (Lampire Biological Laboratories, PA) was treated with RBC lysis buffer (Alfa Aesar) to lyse the RBCs following a centrifuged at 300g for 10 minutes. The RBC free pellet was collected and was washed two more times to remove any debris. The cells from the pellet that should contain most of the peripheral WBCs was incubated with 10 µL of anti- Ly6G antibody SPIO particles for an hour in a 36 °C incubator. Following which the pellet was centrifuged twice to remove any unbound SPIOs and fixed using 2.5% glutaraldehyde solution. The pellet was processed for electron microscopy following standard procedure of 1% Osmium tetroxide staining, gelatin fixation, dehydration, araldite embedding, sectioning, and viewing (TEM, Tecnai 12, 120kV TEM, FEI, Hillsboro, OR, USA).
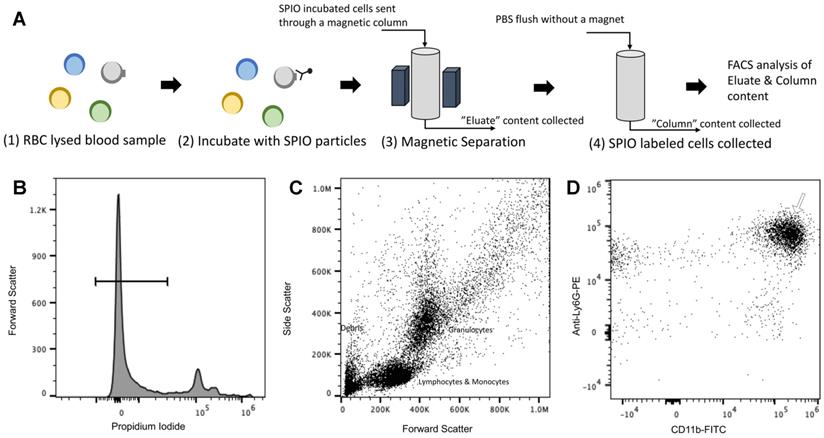
The efficiency of antibody based MPI tracers for tagging neutrophils/immune cells was further analyzed using flow cytometry as shown in Figure 11. A known amount of cell pellet, suspended in 1X PBS after RBC lysis of whole blood, was incubated with different MPI tracers (i.e., VivoTraxTM, anti-Ly6G SPIOs and anti-F4/80 SPIOs). After an hour incubation, the suspension was passed through a magnetic column (Miltenyi Biotec Inc, #130-042-201). The “eluate” was collected under with a magnetic field applied to the column and is formed from the separated untargeted cells (as compared to the particle bound cells in the column). The “column” sample was then collected by flushing the remaining cells in the absence of an applied magnetic field. To emulate conditions similar to in vivo experiments, the SPIO labeled cells were only passed once through the magnetic column. Typically, for magnetic enrichment of a particular cell type, the SPIO labeled cells are passed through the column more than once to achieve higher purity. All samples were diluted equally with 1X-PBS and were stained for viability (propidium iodide), and with anti-Ly6G-PE (Miltenyi Biotec Inc, #130-102-392) and CD11b-FITC (Miltenyi Biotec Inc, #130-113-805) fluorophores. The “column” and “eluate” cell sample were measured using an AttuneTM NxT Flow Cytometer and analyzed using FlowJo (BD, Oregon, USA). The gating procedure for analysis of the flow cytometry data is shown in Figure 11. Untreated RBC lysed whole blood was used as control, providing a gauge of the relative population of the blood cells before the enrichment. The population of granulocytes and Ly6G+CD11b+ cells were calculated as percentage of total counts from the flow cytometer per sample.
Cell Enrichment Analysis of MPI tracers using Flow Cytometry (A) Cells obtained after RBC lysis of mouse blood were incubated with SPIO of interest. The incubated cells were sent through a magnetic column, and unlabeled cells were collected as “eluate” from the column. After removing the magnet utilized for separation, the column was further flushed, and the contents were collected as the “column” subset of cells. The immune cell population from the “eluate” was evaluated for degree of depletion by the SPIO relative to the extent to which it is enriched from the “column” in comparison with control (untouched RBC lysed blood) using flow cytometry. The following gating procedure was carried out on the flow cytometry data: (B) the propidium iodide channel was used to gate live cells, which are negative for the dye, (C) the granulocyte population of immune cells were chosen utilizing the side scatter and forward scatter profile and (D) the cells were analyzed for neutrophil cell marker expression (anti-Ly6G-PE and CD11b-FITC) utilizing the PE and FITC channels. Untouched (i.e. unseparated) samples of RBC lysed blood were used as a control to gauge the native proportion of blood cells in the samples (MPI: magnetic particle imaging; RBC: red blood cells; SPIO: superparamagnetic iron oxide).

The efficiency of enrichment of granulocytes and Ly6G+CD11b+ cells in the “column” contents were compared relative to the same population being depleted in the “eluate” content.
In vivo mouse model of myositis
All animal procedures were conducted according to the National Research Council's Guide for the Care and Use of Laboratory Animals and approved by the Animal Care and Use Committee at UC Berkeley. Female C57BL/6 (7-8 weeks old) were obtained from a UC Berkeley Office of Laboratory Animal Care approved vendor. All animals were monitored weekly for behavior and body weight. Inflammation was induced in a C57BL6 mouse by injecting bacterial lipopolysaccharide (LPS) (O111:B4, 50 µg) into the right thigh muscle. Animals were monitored post-LPS administration for any discomfort and difficulties in walking. All LPS treated mice were sacrificed within 48 hours of inducing inflammation.
Projection, 3D tomography Magnetic Particle Imaging and Image Processing
The bio-distribution was evaluated after i.v. administration of VivoTraxTM and anti-Ly6G SPIO (IgG1, REA526 clone, Miltenyi Biotec, GmbH, after dialysis) iron oxide nanoparticles at a clinically relevant dose (5-5.5 mg of Fe/kg, ∼40 µg of protein/mouse) using a 6.3 T/m/µ0 field-free line MPI scanner using 2D projections, with a field-of-view (FOV) of 10.6 × 6.2 cm2 and using a 40 mTpp drive field at a frequency of 20.225 kHz.2 The scanning bed was mechanically translated in the z-direction in 1 mm increments to complete the imaging trajectory for a single projection, resulting in a five-minute total scan duration, 95 s of which were used for data acquisition. All 2D projection in vivo images were taken with respiratory gating, and reconstructed using the x-space MPI reconstruction algorithm (pixel dimension of 0.04 × 0.034 cm2) [99, 100]. For the inflammation study, the contralateral side of the mouse with respect to the inflamed flank was used as a control. The particles were also injected in a separate cohort of healthy C57BL6 mice. 3D tomography images were acquired post-euthanasia. Forty 2-D projection images were acquired at equally spaced angles and reconstructed using a Radon transformation. All 3D data were re-binned to a voxel dimension of 0.04 × 0.04 × 0.034 cm3.
The CNR was estimated from 2D-MPI projection data acquired. All 2D-projection images were scaled between the minimum and maximum value of the image. The CNR was estimated using the mean signal of ROIs from the inflamed (right) and contralateral (left) flank with the standard deviation of the background as follows:

3-D projection images were post-processed using a high-boost filter and represented as a maximum intensity projection (MIPs). All image processing and MPI data analysis was performed using MATLAB (Mathworks, Natick, MA).
Validation of neutrophil activity and Histology
Bioluminescent validation of localized inflammation was performed by evaluating for myeloperoxidase activity in select mice using an i.p. administration of luminol (XenoLight RediJect Chemiluminescent Inflammation Probe, PerkinElmer, Waltham, MA). 100 µL of luminol was injected 24-hours post LPS-induced myositis, and bioluminescence was measured 10-min after the i.p. injection, using an IVIS Lumina system with a five-minute exposure time and medium binning. The bioluminescent images were analyzed with Fiji [101] and co-registered with an X-ray projection image, taken with XPERT cabinet X-ray system (KUB Technologies, Inc.), as anatomical reference. Tissue were harvested after euthanization and fixed in 10% formalin. Fixed tissue sample was stained for Prussian blue, hematoxylin and eosin (H&E), and myeloperoxidase (LifeSpanBio Sciences, Inc.). Bright field images of the slides were observed using a ZEISS AX10 Observer D1 with a ZEISS Axiocam ERc 5s (ZEISS Microscopy, Germany).
All statistical analysis was carried out using standard student t-test of the means.
Abbreviations
2D: two-dimension; 3D: three-dimension; AWR: arbitrary wave relaxometer; CT: computed tomography; CNR: contrast-to-noise ratio; DH: Hydrodynamic diameter; DLS: dynamic light scattering; Dv: mean magnetic diameter; FITC: Fluorescein isothiocyanate; FOV: field-of-view; FFL: field-free line; FUO: fever of unknown origin; GI: gastrointestinal; H: magnetic field; H&E: Hematoxylin and eosin; Hsat: saturating field; i.p.: Intraperitoneal injection; i.v.: intravenous; LoD: Limit of detection; LPS: lipopolysaccharides; PDI: polydispersity index; PE: Phycoerythrin; M: Magnetization; MIP: maximum intensity projection; MPI: magnetic particle imaging; MPO: myeloperoxidase; MRI: magnetic resonance imaging; Msat: saturation magnetization; mT: millitesla; NCA: non-specific cross-reacting antigen; nm: nanometer; PAF: platelet activation factor; PBS: phosphate buffered saline; PI: propidium iodide; PSF: point-spread function; RBC: red blood cells; RES: reticuloendothelial system; ROI: region of interest; SNR: signal-to-noise ratio; SPIO: superparamagnetic iron oxide (nanoparticles); SSTR: somatostatin receptors; TEM: transmission electron microscopy; VSM: vibrating sample magnetometer; VT: VivoTraxTM; WBC: white blood cells.
Acknowledgements
We gratefully acknowledge support from NIH grants R01s EB019458, EB024578, EB029822 and R44: EB029877, UC TRDRP grant 26IP-0049, M. Cook Chair, Bakar Fellowship, the UC Discovery Award, the Craven Fellowship from UC Berkeley Bioengineering, NSERC PGSD3-532656-2019 fellowship, as well as the NIH-T32 training and NSF fellowships. We would also like to acknowledge the staffs at the University of California Berkeley Electron Microscope Laboratory for their advice and assistance in electron microscopy sample preparation and data collection. We would finally like to acknowledge Jason Hsu of the Salahuddin Lab at UC Berkeley for assisting with our VSM measurements on their lab's equipment.
Competing Interests
Professor Conolly is a co-founder of an MPI startup company, Magnetic Insight, and he holds stock in this company. Dr. Elaine Yu is an employee of Magnetic Insight. The authors declare no other competing interests.
References
1. Yu EY, Bishop M, Zheng B, Ferguson RM, Khandhar AP, Kemp SJ. et al. Magnetic particle imaging: A novel in vivo imaging platform for cancer detection. Nano Lett. 2017;17:1648-54
2. Yu EY, Chandrasekharan P, Berzon R, Tay ZW, Zhou XY, Khandhar AP. et al. Magnetic particle imaging for highly sensitive, quantitative, and safe in vivo gut bleed detection in a murine model. ACS Nano. 2017;11:12067-76
3. Ludewig P, Gdaniec N, Sedlacik J, Forkert ND, Szwargulski P, Graeser M. et al. Magnetic particle imaging for real-time perfusion imaging in acute stroke. ACS Nano. 2017;11:10480-8
4. Orendorff R, Peck AJ, Zheng B, Shirazi SN, Matthew Ferguson R, Khandhar AP. et al. First in vivo traumatic brain injury imaging via magnetic particle imaging. Phys Med Biol. 2017;62:3501-9
5. Tay ZW, Chandrasekharan P, Zhou XY, Yu E, Zheng B, Conolly S. In vivo tracking and quantification of inhaled aerosol using magnetic particle imaging towards inhaled therapeutic monitoring. Theranostics. 2018;8:3676-87
6. Zhou XY, Jeffris KE, Yu EY, Zheng B, Goodwill PW, Nahid P. et al. First in vivo magnetic particle imaging of lung perfusion in rats. Phys Med Biol. 2017;62:3510-22
7. Zhu X, Li J, Peng P, Hosseini Nassab N, Smith BR. Quantitative drug release monitoring in tumors of living subjects by magnetic particle imaging nanocomposite. Nano Lett. 2019;19:6725-33
8. Guzy J, Chakravarty S, Buchanan FJ, Chen H, Gaudet JM, Hix JML. et al. Complex relationship between iron oxide nanoparticle degradation and signal intensity in magnetic particle imaging. ACS Appl Nano Mater. 2020;3:3991-9
9. Chandrasekharan P, Tay ZW, Hensley D, Zhou XY, Fung BK, Colson C. et al. Using magnetic particle imaging systems to localize and guide magnetic hyperthermia treatment: tracers, hardware, and future medical applications. Theranostics. 2020;10:2965-81
10. Chandrasekharan P, Tay ZW, Zhou XY, Yu E, Orendorff R, Hensley D. et al. A perspective on a rapid and radiation-free tracer imaging modality, magnetic particle imaging, with promise for clinical translation. Br J Radiol. 2018;91:20180326
11. Zhou XY, Tay ZW, Chandrasekharan P, Yu EY, Hensley DW, Orendorff R. et al. Magnetic particle imaging for radiation-free, sensitive and high-contrast vascular imaging and cell tracking. Curr Opin Chem Biol. 2018;45:131-8
12. Fuller EG, Scheutz GM, Jimenez A, Lewis P, Savliwala S, Liu S. et al. Theranostic nanocarriers combining high drug loading and magnetic particle imaging. Int J Pharm. 2019;572:118796
13. Sehl OC, Gevaert JJ, Melo KP, Knier NN, Foster PJ. A Perspective on Cell Tracking with Magnetic Particle Imaging. Tomography. 2020;6:315-24
14. Song G, Chen M, Zhang Y, Cui L, Qu H, Zheng X. et al. Janus iron oxides @ semiconducting polymer nanoparticle tracer for cell tracking by magnetic particle imaging. Nano Lett. 2018;18:182-9
15. Zheng B, Vazin T, Goodwill PW, Conway A, Verma A, Saritas EU. et al. Magnetic Particle Imaging tracks the long-term fate of in vivo neural cell implants with high image contrast. Sci Rep. 2015;5:14055
16. Zheng B, von See MP, Yu E, Gunel B, Lu K, Vazin T. et al. Quantitative magnetic particle imaging monitors the transplantation, biodistribution, and clearance of stem cells in vivo. Theranostics. 2016;6:291-301
17. Gonzalez H, Hagerling C, Werb Z. Roles of the immune system in cancer: from tumor initiation to metastatic progression. Genes Dev. 2018;32:1267-84
18. Coffelt SB, Wellenstein MD, de Visser KE. Neutrophils in cancer: neutral no more. Nat Rev Cancer. 2016;16:431-46
19. Makela AV, Gaudet JM, Schott MA, Sehl OC, Contag CH, Foster PJ. Magnetic particle imaging of macrophages associated with cancer: Filling the voids left by iron-based magnetic resonance imaging. Mol Imaging Biol. 2020;22:958-68
20. Wang P, Goodwill PW, Pandit P, Gaudet J, Ross A, Wang J. et al. Magnetic particle imaging of islet transplantation in the liver and under the kidney capsule in mouse models. Quant Imaging Med Surg. 2018;8:114-22
21. A current view on inflammation. Nat Immunol. 2017;18:825
22. DiSabato DJ, Quan N, Godbout JP. Neuroinflammation: the devil is in the details. J Neurochem. 2016;139(Suppl 2):136-53
23. Li Y, Zhou QL, Sun W, Chandrasekharan P, Cheng HS, Ying Z. et al. Non-canonical NF-κB signalling and ETS1/2 cooperatively drive C250T mutant TERT promoter activation. Nat Cell Biol. 2015;17:1327-38
24. Signore A, Quintero AM Eds. Diagnostic imaging of infections and inflammatory diseases: a multidiscplinary approach: John Wiley & Sons Inc.; 2013
25. Uchida T, Nemoto T, Yui T, Matsuda S, Kariyone S. Use of technetium-99m as a radioactive label to study migratory patterns of leukocytes. J Nucl Med. 1979;20:1197-200
26. Palestro CJ, Love C, Tronco GG, Tomas MB, Rini JN. Combined labeled leukocyte and technetium 99m sulfur colloid bone marrow imaging for diagnosing musculoskeletal infection. Radiographics. 2006;26:859-70
27. Hoffer P. Gallium: mechanisms. J Nucl Med. 1980;21:282-5
28. Chitambar CR. Gallium and its competing roles with iron in biological systems. Biochim Biophys Acta. 2016;1863:2044-53
29. Anzola LK, Glaudemans A, Dierckx R, Martinez FA, Moreno S, Signore A. Somatostatin receptor imaging by SPECT and PET in patients with chronic inflammatory disorders: a systematic review. Eur J Nucl Med Mol Imaging. 2019;46:2496-513
30. Jackson AW, Chandrasekharan P, Ramasamy B, Goggi J, Chuang KH, He T. et al. Octreotide functionalized nano-contrast agent for targeted magnetic resonance imaging. Biomacromolecules. 2016;17:3902-10
31. Tong W, Hui H, Shang W, Zhang Y, Tian F, Ma Q. et al. Highly sensitive magnetic particle imaging of vulnerable atherosclerotic plaque with active myeloperoxidase-targeted nanoparticles. Theranostics. 2021;11:506-21
32. Lewis SS, Cox GM, Stout JE. Clinical utility of indium 111-labeled white blood cell scintigraphy for evaluation of suspected infection. Open Forum Infect Dis. 2014;1:ofu089
33. Becker W. The contribution of nuclear medicine to the patient with infection. Eur J Nucl Med. 1995;22:1195-211
34. de Vries EF, Roca M, Jamar F, Israel O, Signore A. Guidelines for the labelling of leucocytes with (99m)Tc-HMPAO. Inflammation/Infection Taskgroup of the European Association of Nuclear Medicine. Eur J Nucl Med Mol Imaging. 2010;37:842-8
35. Roca M, de Vries EF, Jamar F, Israel O, Signore A. Guidelines for the labelling of leucocytes with (111)In-oxine. Inflammation/Infection Taskgroup of the European Association of Nuclear Medicine. Eur J Nucl Med Mol Imaging. 2010;37:835-41
36. Marcus CS, Kuperus JH, Butler JA, Henneman PL, Salk RD, Chen BY. et al. Phagocytic labeling of leukocytes with 99mTc-albumin colloid for nuclear imaging. Int J Rad Appl Instrum B. 1988;15:673-82
37. Settles M, Etzrodt M, Kosanke K, Schiemann M, Zimmermann A, Meier R. et al. Different capacity of monocyte subsets to phagocytose iron-oxide nanoparticles. PLoS One. 2011;6:e25197
38. Baraki H, Zinne N, Wedekind D, Meier M, Bleich A, Glage S. et al. Magnetic resonance imaging of soft tissue infection with iron oxide labeled granulocytes in a rat model. PLoS One. 2012;7:e51770
39. Rivera-Rodriguez A, Hoang-Minh LB, Chiu-Lam A, Sarna N, Marrero-Morales L, Mitchell DA. et al. Tracking adoptive t cell therapy using magnetic particle imaging. bioRxiv. 2020. 2020 06.02.128587
40. Makela AV, Gaudet JM, Murrell DH, Mansfield JR, Wintermark M, Contag CH. Mind over magnets - how magnetic particle imaging is changing the way we think about the future of neuroscience. Neuroscience. 2020
41. Wu LC, Zhang Y, Steinberg G, Qu H, Huang S, Cheng M. et al. A review of magnetic particle imaging and perspectives on neuroimaging. AJNR Am J Neuroradiol. 2019;40:206-12
42. Becker W, Goldenberg DM, Wolf F. The use of monoclonal antibodies and antibody fragments in the imaging of infectious lesions. Semin Nucl Med. 1994;24:142-53
43. Signore A, Quintero AM Eds. Diagnostic imaging of infections and inflammatory diseases: a multidiscplinary approach, Chapter 9. John Wiley & Sons Inc. 2013 p. 147-67
44. Ahrens ET, Bulte JW. Tracking immune cells in vivo using magnetic resonance imaging. Nat Rev Immunol. 2013;13:755-63
45. Toth GB, Varallyay CG, Horvath A, Bashir MR, Choyke PL, Daldrup-Link HE. et al. Current and potential imaging applications of ferumoxytol for magnetic resonance imaging. Kidney Int. 2017;92:47-66
46. Weinstein JS, Varallyay CG, Dosa E, Gahramanov S, Hamilton B, Rooney WD. et al. Superparamagnetic iron oxide nanoparticles: diagnostic magnetic resonance imaging and potential therapeutic applications in neurooncology and central nervous system inflammatory pathologies, a review. J Cereb Blood Flow Metab. 2010;30:15-35
47. Gaudet JM, Makela AV, Foster PJ. Abstract 1138: Non-invasive detection and quantification of tumor-associated macrophage density with magnetic particle imaging. Cancer Research. 2019;79:1138 -
48. Temme S, Bönner F, Schrader J, Flögel U. 19F magnetic resonance imaging of endogenous macrophages in inflammation. Wiley Interdiscip Rev Nanomed Nanobiotechnol. 2012;4:329-43
49. Shin SH, Kadayakkara DK, Bulte JW. In vivo (19)F MR imaging cell tracking of inflammatory macrophages and site-specific development of colitis-associated dysplasia. Radiology. 2017;282:194-201
50. Jacoby C, Temme S, Mayenfels F, Benoit N, Krafft MP, Schubert R. et al. Probing different perfluorocarbons for in vivo inflammation imaging by 19F MRI: image reconstruction, biological half-lives and sensitivity. NMR Biomed. 2014;27:261-71
51. Tay ZW, Goodwill PW, Hensley DW, Taylor LA, Zheng B, Conolly SM. A high-throughput, arbitrary-waveform, MPI spectrometer and relaxometer for comprehensive magnetic particle optimization and characterization. Sci Rep. 2016;6:34180
52. Miltenyi S, Müller W, Weichel W, Radbruch A. High gradient magnetic cell separation with MACS. Cytometry. 1990;11:231-8
53. Anselmo AC, Mitragotri S. Nanoparticles in the clinic. Bioeng Transl Med. 2016;1:10-29
54. Keselman P, Yu EY, Zhou XY, Goodwill PW, Chandrasekharan P, Ferguson RM. et al. Tracking short-term biodistribution and long-term clearance of SPIO tracers in magnetic particle imaging. Phys Med Biol. 2017;62:3440-53
55. Tay ZW, Hensley DW, Chandrasekharan P, Zheng B, Conolly SM. Optimization of drive parameters for resolution, sensitivity and safety in magnetic particle imaging. IEEE Trans Med Imaging. 2020;39:1724-34
56. Tay ZW, Hensley D, Ma J, Chandrasekharan P, Zheng B, Goodwill P. et al. Pulsed excitation in magnetic particle imaging. IEEE Trans Med Imaging. 2019;38:2389-99
57. Eberbeck D, Wiekhorst F, Wagner S, Trahms L. How the size distribution of magnetic nanoparticles determines their magnetic particle imaging performance. Appl Phys Lett. 2011;98:182502
58. Chantrell R, Popplewell J, Charles S. Measurements of particle size distribution parameters in ferrofluids. IEEE Trans Magn. 1978;14:975-7
59. Tay ZW, Hensley DW, Vreeland EC, Zheng B, Conolly SM. The Relaxation Wall: Experimental Limits to Improving MPI Spatial Resolution by Increasing Nanoparticle Core size. Biomed Phys Eng Express. 2017 3
60. Zheng B, Goodwill PW, Dixit N, Xiao D, Zhang W, Gunel B. et al. Optimal broadband noise matching to inductive sensors: Application to magnetic particle imaging. IEEE Trans Biomed Circuits Syst. 2017;11:1041-52
61. Bauer LM, Situ SF, Griswold MA, Samia AC. Magnetic particle imaging tracers: State-of-the-art and future directions. J Phys Chem Lett. 2015;6:2509-17
62. Hensley D, Goodwill P, Croft L, Conolly S. Preliminary experimental X-space color MPI. 2015 5th International Workshop on Magnetic Particle Imaging (IWMPI). 2015 p. 1-
63. Lu Y, Rivera-Rodriguez A, Tay ZW, Hensley D, Fung KLB, Colson C. et al. Combining magnetic particle imaging and magnetic fluid hyperthermia for localized and image-guided treatment. Int J Hyperthermia. 2020;37:141-54
64. Hensley DW. Exploiting magnetic relaxation in x-space magnetic particle imaging [PhD dissertation]: UC Berkeley; 2017
65. Diana Nicoll, Chuanyi Mark Lu, Stephen J. McPhee, Eds. Guide to Diagnostic Tests, 7e.: McGraw-Hill. 2017
66. O'Connell KE, Mikkola AM, Stepanek AM, Vernet A, Hall CD, Sun CC. et al. Practical murine hematopathology: a comparative review and implications for research. Comp Med. 2015;65:96-113
67. Jacobsen C, Steensgaard J. Binding properties of monoclonal anti-IgG antibodies: analysis of binding curves in monoclonal antibody systems. Immunology. 1984;51:423-30
68. Bulte JW, Hoekstra Y, Kamman RL, Magin RL, Webb AG, Briggs RW. et al. Specific MR imaging of human lymphocytes by monoclonal antibody-guided dextran-magnetite particles. Magn Reson Med. 1992;25:148-57
69. Josef Neumüller, Sylvia Emanuela Neumüller-Guber, Johannes Huber, Adolf Ellinger, Wagner T. Development of myeloid dendritic cells under the influence of sexual hormones visualized using scanning and transmission electron microscopy. Modern Electron Microscopy in Physical and Life Sciences, Milos Janecek and Robert Kral: IntechOpen. 2016
70. Lee PY, Wang JX, Parisini E, Dascher CC, Nigrovic PA. Ly6 family proteins in neutrophil biology. J Leukoc Biol. 2013;94:585-94
71. Austyn JM, Gordon S. F4/80, a monoclonal antibody directed specifically against the mouse macrophage. Eur J Immunol. 1981;11:805-15
72. Lin H-H, Faunce DE, Stacey M, Terajewicz A, Nakamura T, Zhang-Hoover J. et al. The macrophage F4/80 receptor is required for the induction of antigen-specific efferent regulatory T cells in peripheral tolerance. J Exp Med. 2005;201:1615-25
73. Reimer P, Balzer T. Ferucarbotran (Resovist): a new clinically approved RES-specific contrast agent for contrast-enhanced MRI of the liver: properties, clinical development, and applications. Eur Radiol. 2003;13:1266-76
74. Kirschbaum K, Sonner JK, Zeller MW, Deumelandt K, Bode J, Sharma R. et al. In vivo nanoparticle imaging of innate immune cells can serve as a marker of disease severity in a model of multiple sclerosis. Proc Natl Acad Sci U S A. 2016;113:13227-32
75. Shah A, Dobrovolskaia MA. Immunological effects of iron oxide nanoparticles and iron-based complex drug formulations: Therapeutic benefits, toxicity, mechanistic insights, and translational considerations. Nanomedicine. 2018;14:977-90
76. Wang YX, Xuan S, Port M, Idee JM. Recent advances in superparamagnetic iron oxide nanoparticles for cellular imaging and targeted therapy research. Curr Pharm Des. 2013;19:6575-93
77. Tseng JC, Kung AL. In vivo imaging method to distinguish acute and chronic inflammation. J Vis Exp. 2013
78. Gross S, Gammon ST, Moss BL, Rauch D, Harding J, Heinecke JW. et al. Bioluminescence imaging of myeloperoxidase activity in vivo. Nat Med. 2009;15:455-61
79. Senéterre E, Weissleder R, Jaramillo D, Reimer P, Lee AS, Brady TJ. et al. Bone marrow: ultrasmall superparamagnetic iron oxide for MR imaging. Radiology. 1991;179:529-33
80. Copeland S, Warren HS, Lowry SF, Calvano SE, Remick D. Acute inflammatory response to endotoxin in mice and humans. Clin Diagn Lab Immunol. 2005;12:60-7
81. Weissleder R, Lee AS, Fischman AJ, Reimer P, Shen T, Wilkinson R. et al. Polyclonal human immunoglobulin G labeled with polymeric iron oxide: antibody MR imaging. Radiology. 1991;181:245-9
82. Lameijer MA, Tang J, Nahrendorf M, Beelen RH, Mulder WJ. Monocytes and macrophages as nanomedicinal targets for improved diagnosis and treatment of disease. Expert Rev Mol Diagn. 2013;13:567-80
83. Shen F, Park JK. Toxicity assessment of iron oxide nanoparticles based on cellular magnetic loading using magnetophoretic sorting in a trapezoidal microchannel. Anal Chem. 2018;90:920-7
84. Tjandra JJ, Ramadi L, McKenzie IF. Development of human anti-murine antibody (HAMA) response in patients. Immunol Cell Biol. 1990;68( Pt 6):367-76
85. Line BR, Breyer RJ, McElvany KD, Earle DC, Khazaeli MB. Evaluation of human anti-mouse antibody response in normal volunteers following repeated injections of fanolesomab (NeutroSpec), a murine anti-CD15 IgM monoclonal antibody for imaging infection. Nucl Med Commun. 2004;25:807-11
86. Tanaka Y, Nagai Y, Kuroishi T, Endo Y, Sugawara S. Stimulation of Ly-6G on neutrophils in LPS-primed mice induces platelet-activating factor (PAF)-mediated anaphylaxis-like shock. J Leukoc Biol. 2012;91:485-94
87. Yipp BG, Kubes P. Antibodies against neutrophil LY6G do not inhibit leukocyte recruitment in mice in vivo. Blood. 2013;121:241-2
88. Baselga J. Clinical trials of Herceptin(trastuzumab). Eur J Cancer. 2001;37(Suppl 1):S18-24
89. Raedler LA. Keytruda (Pembrolizumab): First PD-1 inhibitor approved for previously treated unresectable or metastatic melanoma. Am Health Drug Benefits. 2015;8:96-100
90. Yang JC, Hughes M, Kammula U, Royal R, Sherry RM, Topalian SL. et al. Ipilimumab (anti-CTLA4 antibody) causes regression of metastatic renal cell cancer associated with enteritis and hypophysitis. J Immunother. 2007;30:825-30
91. Fong L, Small EJ. Anti-cytotoxic T-lymphocyte antigen-4 antibody: the first in an emerging class of immunomodulatory antibodies for cancer treatment. J Clin Oncol. 2008;26:5275-83
92. Fong L, Kwek SS, O'Brien S, Kavanagh B, McNeel DG, Weinberg V. et al. Potentiating endogenous antitumor immunity to prostate cancer through combination immunotherapy with CTLA4 blockade and GM-CSF. Cancer Res. 2009;69:609-15
93. Bucher K, Schmitt F, Autenrieth SE, Dillmann I, Nürnberg B, Schenke-Layland K. et al. Fluorescent Ly6G antibodies determine macrophage phagocytosis of neutrophils and alter the retrieval of neutrophils in mice. J Leukoc Biol. 2015;98:365-72
94. Thakur ML, McAfee JG. The significance of chromosomal aberrations in indium-111-labeled lymphocytes. J Nucl Med. 1984;25:922-7
95. Ak I, Vardereli E, Durak B, Gülbaş Z, Basaran N, Stokkel MP. et al. Labeling of mixed leukocytes with (99m)Tc-HMPAO causes severe chromosomal aberrations in lymphocytes. J Nucl Med. 2002;43:203-6
96. Boutry S, Forge D, Burtea C, Mahieu I, Murariu O, Laurent S. et al. How to quantify iron in an aqueous or biological matrix: a technical note. Contrast Media Mol Imaging. 2009;4:299-304
97. Rimkus G, Bremer-Streck S, Grüttner C, Kaiser WA, Hilger I. Can we accurately quantify nanoparticle associated proteins when constructing high-affinity MRI molecular imaging probes? Contrast Media Mol Imaging. 2011;6:119-25
98. Kákay A, Gutowski MW, Takacs L, Franco V, Varga LK. Langevin granulometry of the particle size distribution. Journal of Physics A: Mathematical and General. 2004;37:6027-41
99. Goodwill PW, Conolly SM. The X-space formulation of the magnetic particle imaging process: 1-D signal, resolution, bandwidth, SNR, SAR, and magnetostimulation. IEEE Trans Med Imaging. 2010;29:1851-9
100. Goodwill PW, Konkle JJ, Zheng B, Saritas EU, Conolly SM. Projection x-space magnetic particle imaging. IEEE Trans Med Imaging. 2012;31:1076-85
101. Schindelin J, Arganda-Carreras I, Frise E, Kaynig V, Longair M, Pietzsch T. et al. Fiji: an open-source platform for biological-image analysis. Nat Methods. 2012;9:676-82
Author contact
![]() Corresponding author: Prashant Chandrasekharan, K.L. Barry Fung, Department of Bioengineering, University of California, Berkeley, California 94720, United States. Email: prashantcedu
Corresponding author: Prashant Chandrasekharan, K.L. Barry Fung, Department of Bioengineering, University of California, Berkeley, California 94720, United States. Email: prashantcedu