
 Global reach, higher impact
Nanotheranostics 2024; 8(4):506-520. doi:10.7150/ntno.96286 This issue Cite
Review
Therapeutic and Contrast Agents for Photoacoustic Imaging-Guided Photothermal Therapy: A Narrative Review
Donni Kis Apriyanto1,2, Mitrayana1, Andreas Setiawan3, Rini Widyaningrum4 ![]()
1. Department of Physics, Faculty of Mathematics and Natural Sciences, Universitas Gadjah Mada, Yogyakarta 55281, Indonesia.
2. Department of Physics, Faculty of Mathematics and Natural Sciences, Universitas Lampung, Bandar Lampung 35141, Indonesia.
3. Department of Physics, Faculty of Science and Mathematics, Universitas Kristen Satya Wacana, Salatiga 50711, Indonesia.
4. Department of Dentomaxillofacial Radiology, Faculty of Dentistry, Universitas Gadjah Mada, Yogyakarta 55281, Indonesia.
Received 2024-3-14; Accepted 2024-6-29; Published 2024-8-1
Abstract

Photoacoustic imaging is a hybrid modality that combines high-contrast and spectroscopy-based optical imaging specificity with the high spatial resolution of ultrasonography. This review highlights the development and progress of photoacoustic imaging technology over the past decade. This imaging technology has evolved to be more user-friendly, cost-effective, and portable, demonstrating its potential for diverse clinical applications. A potential clinical application lies in the use of photoacoustic imaging as a guiding tool for photothermal therapy. This review was conducted by initially filtering through three databases, namely, Google Scholar, PubMed, and Scopus, resulting in 460 articles published between 2019 and May 2023. Of these, 54 articles were deemed suitable for review after identification. The selected articles were research papers focusing on the development of therapeutic agents that enhance contrast in photoacoustic imaging. All reviewed articles tested these agents both in vitro and in vivo. This review focuses on wavelength absorption and radiation sources for photothermal therapy. The developed agents predominantly used NIR-I wavelengths, whereas the NIR-II region has been less explored, indicating significant potential for future research. This review provides comprehensive insights into the advancement of compounds serving as therapeutic agents and contrast agents in photoacoustic imaging-guided photothermal therapy.
Keywords: near-infrared wavelength, radiation, absorption, in vitro, in vivo
Introduction
Photoacoustic imaging is a hybrid modality that combines high-contrast and spectroscopy-based optical imaging specificity with the high spatial resolution of ultrasonography [1]. Several instrument configurations in photoacoustic imaging are employed: optical resolution-photoacoustic microscopy, acoustic resolution-photoacoustic microscopy, photoacoustic tomography/computed tomography, and photoacoustic endoscopy [2]. Each configuration has different resolutions and depths and can be used as required. A review of the development and progress of photoacoustic imaging technology over the past decade revealed that this imaging technology has evolved to be more user-friendly, cost-effective, and portable, demonstrating its potential for diverse clinical applications [3]. Research involving the application of photoacoustic imaging techniques as monitoring and detection tools in the medical field has been extensive. These include monitoring blood clots during microbubble-assisted sonothrombolysis [4], studying hemodynamic changes caused by blood pressure variations [5], assessing the efficacy of the vascular disrupting agent 5,6-dimethylxanthenone-4-acetic acid through quantitative analysis [6], and studying deep vascularization for regenerative applications [7]. Furthermore, photoacoustic imaging holds potential as a guiding tool for various medical procedures requiring intervention, such as drug delivery, therapy, surgery, and biopsy [8].
In addition to diagnostic applications, photoacoustic research extensively focuses on the development of diagnostic and therapeutic systems (theranostics) and drug monitoring strategies [9]. Photothermal therapy (PTT) is currently under development and uses photoacoustic imaging as a guiding tool. In addition to conventional cancer therapies, PTT represents an alternative and innovative approach to cancer treatment. PTT is a therapeutic modality that uses light-absorbing agents to heat and selectively destroy cancer cells or other abnormal tissues without harming healthy cells [10]. The hybridization of photoacoustic imaging and PTT demonstrates clear advantages in monitoring and treating tumors because of its high efficiency, spatial specificity, fewer side effects, and ease of operation [11].
Photoacoustic imaging has been extensively investigated as a guide for PTT. These studies have focused on various compounds that assist in disease therapy and agents to enhance the contrast of photoacoustic imaging results. These agents assist in the more precise visualization of targets such as tumors or other diseases, especially at the cellular level. Using photoacoustic imaging, medical professionals can obtain valuable information about tumors' location, size, and characteristics. In addition to their use in diagnosis, these agents possess therapeutic properties. They can generate heat when exposed to light radiation, which can be utilized to destroy or damage cancer cells in photothermal therapy. This approach allows for more targeted and precise treatment, minimizing damage to surrounding healthy tissue. Compounds used as agents in PTT are formulated using various compound mixtures; as a result, they possess different maximum absorption wavelengths. Therefore, this review summarizes recent advancements in agents for photoacoustic imaging as guides for PTT based on their components, absorption wavelength ranges, and in vitro and in vivo PTT applications.
Furthermore, this review can serve as a reference for the development of agents that enhance image contrast in photoacoustic imaging and possess therapeutic properties for treating diseases such as cancer. Thus, these potential agents can be highly efficient and effective diagnostic and therapeutic tools. This review also provides conclusions and a brief discussion on the challenges and perspectives and the potential future directions of PTT agents that simultaneously enhance photoacoustic imaging contrast.
Methods
A comprehensive literature search was conducted to filter articles related to photoacoustic imaging-guided PTT. Articles were obtained from the Google Scholar, PubMed, and Scopus databases. The literature search used the keywords “photoacoustic imaging” and “photothermal therapy.” The Boolean operator “AND” and phrase searching (“ ”) were explicitly used to facilitate the search. Clinical trials, case series, case reports, and other relevant articles were considered for review. The selected articles were those published between early 2019 and May 2023. The identified review articles should have been included in the initial evaluation. The initial assessment involved identifying titles through literature searches. Articles not written in English or inaccessible in full text were excluded from the initial evaluation. A flowchart of the search and literature selection process is shown in Figure 1. The included studies were evaluated and then organized in a table based on the article title, agent and compound type, cells used in vitro or in vivo, peak absorption wavelength, photoacoustic wavelength, PTT laser wavelength, and compound temperature change when exposed to laser irradiation.
Selection diagram and literature search.
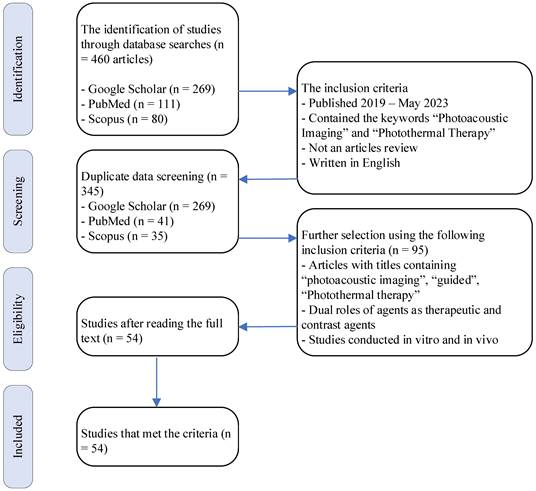
The exclusion criteria were applied after creating the table to eliminate articles. Further selection of articles was based on titles containing “photoacoustic imaging,” “guided,” and “photothermal therapy.” In addition, articles featuring compounds used as therapeutic and contrast agents were considered. Articles combining in vitro and in vivo methods were selected for inclusion in this literature review.
Results and Discussion
Initial screening across the three databases yielded 460 articles. After removing duplicates, 345 articles were included in the initial evaluation. Based on further selection using the following inclusion criteria, 95 articles were selected for further review. During the subsequent review process, 54 articles were deemed suitable for review (Figure 1). The summary of the article review is organized into Table 1, Table 2, Table 3, and Table 4. Table 1 presents the optical characteristics of the agent compounds, including the agent name, type, absorption wavelength (λabs), wavelength used for generating photoacoustic images (λPA), imaging modality used, and tool used for image generation. Table 2 summarizes the distribution of agents based on their absorption wavelengths. Table 3 summarizes the thermal characteristics of the agent compounds in the in vitro methods. This includes the agent's name, cells used in vitro, therapeutic technique employed, radiation wavelength delivered (λRad), radiation source power, duration of agent radiation, temperature increase, and temperature achieved during the provided radiation time, and photothermal conversion efficiency of the agent. Table 4 presents data related to the thermal characteristics of the agent compounds in the in vivo methods. It contains the agent's name, cells implanted in experimental animals, therapeutic technique used, tool for visualizing the agent's temperature in experimental animals, radiation wavelength delivered (λRad), radiation source power, duration of agent radiation, temperature increase, and temperature achieved during the provided radiation time.
Summary of the optical characteristics of the agents and imaging modalities
| Agent | Type | λabs (nm) | λPA (nm) | Imaging modality | PAI tools | Ref |
|---|---|---|---|---|---|---|
| Polydopamine-coated mesoporous silica-gold nanorods (PDA-AuNRs@MSN) | Organic-inorganic | 450 | 875 | PAI | Vevo LAZR | [15] |
| Diketopyrrolopyrrole benzothiadiazole nanoparticles (DPP-BT NP) | Organic Semiconducting polymer | 686 | 808; 730 | Fluorescent; PA | Nexus 128 | [16] |
| Polyethylene glycol- and polyethyleneimine-modified gold nanorods (mPEG-PEI-AuNRs); mPEG-PEI and calcium carbonate nanoparticles (mPEG-PEI/CaNPs) | Organic-inorganic | n/a | n/a | Fluorescent; PAI | MSOT InVision 128 | [17] |
| Gold, 11-mercaptoundecanoic acid, and 10-mercaptodecyl) trimethylammonium bromide nanoparticles (Au-MUA-TMA) | Organic-inorganic | 524 | n/a | PAI | MSOT InVision 128 | [18] |
| Benzobisthiadiazole (BBTD-1302) | Organic semiconducting polymer | 942 | 1302; 942 | Fluorescent; PAI | MSOT imaging system | [19] |
| Emeraldine salt of polyaniline in sodium bis(2-ethylhexyl) sulfosuccinate (PANI-ES@AOT) | Organic-inorganic | n/a | 808; 970 | PAI | Vero LAZR-X mX550D | [20] |
| 1T Molybdenum disulfide (1T-MoS2); 2H Molybdenum disulfide (2H-MoS2) | Inorganic | 1300; 427, 606, 653 | 1280 | PAI | n/a | [21] |
| Benzodithiophene-Thieno[3,4-b]thiophene (BDT-TH); Benzodithiophene-Naphthalenediimide (BDT-NDI) | Organic Semiconducting polymer | 516; 700 | 532; 700 | PAT | Homemade PA system | [22] |
| Boron-dipyrromethene-Fe nanoparticles (BDP-Fe NPs) | Organic-inorganic | 1300 | 1064 | PAI | n/a | [23] |
| 3-azidopropylamine (-N3-) with Bi2S3-Ag2S-DATS@BSA nanoparticles (AB-DS@BSA-N3 NYs) | Organic-inorganic | 900 | 808 | Fluorescent; PAI | MSOT; II900/1700 in vivo imaging System (808 nm, 150 ms) | [24] |
| Hollow mesoporous carbon spheres-polyethylene glycol-gambogic acid (HMCS-PEG-GA) | Organic-inorganic | 808 | 715 | PAI | High-resolution preclinical photoacoustic system | [25] |
| Melanin nanoparticles H2 (MNPH2) | Organic | 457 | 808 | PAI | The MSOT scanner consists of a range of 680-980 nm | [26] |
| Folic acid-conjugated chitosan-functionalized graphene oxide (FA-CS-GO) | Organic-inorganic | 578, 720 | 532 | PAI | PAM system (using a Q-switched diode-pumped solid-state laser (SPOT-10-100-532) and a commercially focused transducer (V324-SM); a reflection-mode fluorescent imaging system | [27] |
| Diketopyrrolopyrrole (DPP) was copolymerized with strong electron-donating substitutes (fluorene and thiophene) (PFTDPP); PFTDPP combined with S-nitroso-N-acetylpenicillamine (PFTDPP-SNAP NPs) | Organic | 350-500, 550-900 | 808 | Fluorescent; PAI | PA imaging | [28] |
| Porphyrin-based covalent organic framework nanoparticles (COF-366 NPs) | Organic | 590, 297 | n/a | PAI | MSOT InVision 128 | [29] |
| CoCuFe-selenide (CCFS)-polyvinyl pyrrolidone (PVP)-L-arginine (L-Arg) (CPA nanocomposite) | Organic | 808 | n/a | PAI | MSOT InVision 128 | [30] |
| Squaraine dye nanoparticles (SQ-NPs) | Dye | 600-800 | 760 | PAI | n/a | [31] |
| Molybdenum(V)-based polyoxometalate (POMs) | Inorganic | 1065 | 1064 | PAI | MSOT InVision 128 | [32] |
| Cyclo(Arg-Gly-Asp-Dphe-Lys) @ polymer dithienopyrrole -thiadiazolobenzotriazole (cRGD@PT NPs) | Organic | 1000 | 1064 | PAI | LOS-3D Photoacoustic imaging | [33] |
| ISSzyme | Organic-inorganic | 700 | 532 | PAI | Homemade PACT system (Q-switched Nd: YAG laser (532 nm)) | [34] |
| SY1080 NPs | Organic dye | 820 | 808 | Fluorescent; PAI | MSOT imaging system | [35] |
| Bodipy-1O2 methoxyl (B-OMe-NPs) | Organic | 735 | 809 | Fluorescent; PAI | n/a | [36] |
| PEG-modified boron quantum dots (BQDs-PEG) | Organic-inorganic | n/a | 808 | Fluorescent; PAI | n/a | [37] |
| Y16-Pr-PEG NPs | Organic | 800 | 808 | Fluorescent; PAI | Confocal laser scanning microscopy (Leica SP8); Near-infrared InGaAs array imaging detector (EX, 808 nm; 2 W/cm2) | [38] |
| Gold nanostar polyaniline hyaluronic acid (AuNSPHs) | Organic-inorganic | n/a | 850 | PAI | VisualSonics Vevo LAZR | [39] |
| pyrazino[2,3g]quinoxaline (PQs)-TPA NPs | Organic small molecules | 675 | 760 | Fluorescent; PAI | MSOT InVision 128 | [40] |
| Melanin-nanoparticular polydopamine-indocyanine green (Mel-pDA-ICG) | Organic dye | 808 | 808 | Fluorescent; PAI | VEVO LAZR-X (at a wavelength of 680-970 nm | [41] |
| Pt/Te nanoheterostructures (PT); mPT | Inorganic | n/a | 744 | PAI | 744 nm, 120 nJ laser by the high-resolution PAI system) | [42] |
| Hemicyanine dye nanoparticles (M1 NPs) | Organic dye | 734, 1040 | 734; 1040 | Fluorescent; PAI | Perkin Elmer IVIS Lumina III; PACT scanner (inVision256-TF) | [43] |
| PEGylated Sb-835 NPHs | Inorganic | 835 | 835 | Fluorescent; PAI | n/a | [44] |
| Au-MBA denotes 4-mercaptobenzoic acid-Cy7 (Au44MBA26-Cy7) NCs | Organic-inorganic dye | 497, 590, 794 | 808 | Fluorescent; PAI | n/a | [45] |
| Janus chitosan/gold quantum dots (J-Au-CS-QD) | Organic-inorganic | 808 | 690 | Fluorescent; PAI | n/a | [46] |
| Gold nanoparticle-coated reduced graphene oxide (rGO-AuNP) | Organic-inorganic | 1000 | 1250 | US + PAI | VisualSonic Vevo 2100 LAZR (40 MHz) | [47] |
| MoSe2-x nanoflowers (MNFs) | Inorganic | n/a | 800 | PAI | Endra Nexus 128 | [48] |
| W18O49 nanorods | Inorganic | n/a | n/a | PAI | MSOT imaging system | [49] |
| Polymer PIIGDTS nanoparticles with folic acid modification (PD-FA) | Organic | 450, 845 | 845 | PAI | MSPAM system (wavelength tunable nanosecond pulsed OPO laser (Continuum, USA), ultrasound transducer with a central frequency of 25 MHz (Olympus, USA)) | [50] |
| Diketopyrrolopyrrole (DPP)-SO; DPP-SS; DPP-SSe NPs | Organic | 900; 912; 960 | PAI | MSOT imaging system | [51] | |
| Fe3+ complex Zwitterionic dopamine sulfonate (Fe-ZDS) | Organic-inorganic | 450-900 | 680, 808 | MRI; PAI | PA imager under the excitation of 680 or 808-nm pulse lasers | [52] |
| Mo2C-derived polyoxometalate (POM) | Inorganic | 1060 | n/a | PAI | NIR-II PAI images | [53] |
| DPP-SS; DPP-OF; DPP-SF; DPP-SeF NP | Organic | 726; 735; 816; 820 | n/a | PAI | MSOT InVision 128 | [54] |
| PEG-modified polydopamine (MPDA-PEG) | Organic | n/a | n/a | PAI | High-resolution preclinical PAI system | [55] |
| TMB-F4TCNQ; TMB-TCNQ | Organic dye | 400; 392 | 1300 | PAI | PA images under 1300-nm laser excitation | [56] |
| IDCIC NPs | Organic | 682 | 780; -1000 | Fluorescent; PAI | FLI (FC-W-980-30W); PACT Scanner (Invision256-TF) | [57] |
| Glypican-3-binding peptide-Fe3O4 Core/Au shell nanocomplex (GBP-FANB) | Inorganic | 520-680 | 640 | Fluorescent; PAI | FLI (IVIS Lumina II (Excitation Filter: 640 nm, Emission Filter: 700 nm); PA (Endra Nexus128) | [58] |
| Indacenodithiophene (IDT)-BTzTD Pdots | Organic | 800 | n/a | CT, fluorescent; PAI | SuperArgus (with the following parameters: 50 kV, 300 μA, 33-μm resolution, and 300 ms of exposure time) PAI: homemade PAI system | [59] |
| Au@Cu2‑xSe NPs | Inorganic | NIR | 808 | CT; PAI | VEVO LAZR-X | [60] |
| FA-doxorubicin (DOX)-indocyanine green (ICG)-perfluoropentane (PFP)@Lip | Organic | 450 | n/a | US; PAI | n/a | [61] |
| Manganese pentacarbonyl bromide-loaded g-carbon nitride/polypyrrole (MnCO@CNPpy) | Organic-inorganic | 410-430 | n/a | PAI | Vevo LAZR-X (40 MHz) | [62] |
| Gold nanostars (GNS); Silica@GNS | Organic-inorganic | 850 | 850 | PAI | PA system (OPO laser 850 nm; hydrophone (HNC-1500, ONDA, Sunnyvale, CA); amplifier (5072PR, OLYMPUS, Waltham, MA); transducer (Immersion Transducers, Olympus Corp., Tokyo, Japan) with a center frequency of 5 MHz; TWPA-I | [63] |
| ZrO2-x@PEG/Ce6 (ZPC NPs) | Organic-inorganic | ~405; ~660 | n/a | Fluorescent; PAI | Fusion FX Spectra; Vevo LAZR-X multimodal imaging system | [64] |
| Gold nanorod melanin nanoparticles (GNR@MNPs)-Gd-64 Cu | Organic-inorganic | 700-900 | 680-980 | PET; MRI; PAI | Siemens Inveon micro PET; 3.0-T MR scanner; MSOT inSight 128 (under a 680-980 nm pulse laser); | [65] |
| PFTQ-PEG-Gd NPs | Organic-inorganic | 760 | 760 | FLI; MRI; PAI | CDD: NIRvana TE 640; micro-MRI scanner (0.5 T, NIUMAG, NMI20-015 V-I, TE/TR = 18/120 ms); Vevo LAZR PAI System | [66] |
| Ag2S@M-P-RGD | Organic-inorganic | 275 | 744 | FLI; PAI | n/a | [67] |
| Au@PB@Cu2O@BPQDs/PAH NCs | Organic-inorganic | 650-950 | 514; 650 | MRI; PAI | 3.0 T clinical MRI system; PAI n/a | [68] |
PS: n/s signifies that the information provided is not written or not detailed.
Summary of agent distribution based on their absorbance wavelength regions
| λabs (nm) | Agents |
|---|---|
| Visible region (400-700 nm) | PDA-AuNRs@MSN [15]; DPP-BT NP [16]; Au-MUA-TMA [18]; 2H-MoS2 [21]; BDT-TH; BDT-NDI [22]; MNPH2 [26]; FA-CS-GO [27]; PFTDPP [28]; COF-366 NPs [29]; ISSzyme [34]; PQs-TPA NPs [40]; Au44MBA26-Cy7 NCs [45]; PD-FA [50]; Fe-ZDS [52]; TMB-F4TCNQ; TMB-TCNQ [56]; IDCIC NPs [57]; GBP-FANB [58]; DOX- ICG-PFP@Lip [61]; MnCO@CNPpy [62]; ZPC NPs [64]; Ag2S@M-P-RGD [67]; |
| NIR-I (700-1000 nm) | BBTD-1302 [19]; AB-DS@BSA-N3 NYs [24]; HMCS-PEG-GA [25]; FA-CS-GO [27]; PFTDPP-SNAP NPs [28]; CPA nanocomposite [30]; SQ-NPs [31]; SY1080 NPs [35]; B-OMe-NPs [36]; Y16-Pr-PEG NPs [38]; Mel-pDA-ICG [41]; M1 NPs [43]; PEGylated Sb-835 NPHs [44]; Au44MBA26-Cy7 NCs [45]; J-Au-CS-QD [46]; PD-FA [50]; DPP-SO; DPP-SS; DPP-SSe NPs [51]; Fe-ZDS [52]; DPP-SS; DPP-OF; DPP-SF; DPP-SeF NP [54]; IDT-BTzTD Pdots [59]; Au@Cu2‑xSe NPs [60]; GNS; Silica@GNS [63]; GNR@MNPs-Gd-64 Cu [65]; PFTQ-PEG-Gd NPs [66]; Au@PB@Cu2O@BPQDs/PAH NCs [68] |
| NIR-II (1000-1700 nm) | 1T-MoS2 [21]; BDP-Fe NPs [23]; POMs [32]; cRGD@PT NPs [33]; M1 NPs [43]; rGO-AuNP [47]; POM [53]; |
Summary of the effects of photothermal agents in vitro
| Agents | Cells | Therapy | λRad (nm) | Power Rad (W/cm2) | Time Rad (s) | ΔT (°C) | Tmax (°C) | Efficiency (%) | Ref |
|---|---|---|---|---|---|---|---|---|---|
| PDA-AuNRs@MSN | 4T1 | PTT | 808 | 1 | 600 | 31.4 | n/a | 34.71 | [15] |
| DPP-BT NP | HeLa | PDT; PTT | 730 | 1 | 600 | 21.8 | 43.6 | 50 | [16] |
| mPEG-PEI-AuNRs; mPEG-PEI/CaNPs | MCF-7, HeLa, 293T | UST; PTT | 808 | 1.5; 0.8 | 600; 360 | n/a | 60 | 27.7 | [17] |
| Au-MUA-TMA | U87MG | PTT | 808 | 1 | 600 | 28 | 65 | n/a | [18] |
| BBTD-1302 | 4T1 | PTT | 980 | 1 | n/a | 23 | n/a | 28.6 | [19] |
| PANI-ES@AOT | HeLa, MCF-7 | PTT | 1064 | 1 | 300 | 31.1 | n/a | 43.9 | [20] |
| 1T-MoS2 nanodots; 2H-MoS2 | A549; HeLa | PTT | 808; 1064 | 1 | 480 | 43; 12.4 | n/a | 43.3; 21.3 | [21] |
| BDT-TH; BDT-NDI | MCF-7 | (LED) PTT | 660 | 0.2 | 600 | 25-30 | n/a | 40 | [22] |
| BDP-Fe NPs | HeLa | PTT | 730 | n/a | 600 | 23 | n/a | 49 | [23] |
| AB-DS@BSA-N3 NYs | Hep-2 | PTT | 808 | 1 | 300 | n/a | 60.9 | 31.6 | [24] |
| HMCS-PEG-GA | HepG2 | PTT | 808 | 1 | 300 | 32.3 | 57.3 | 47.3 | [25] |
| MNPH2 | Hep-2 | PTT | 808 | 0.75 | 300 | n/a | 63.8 | 25.7 | [26] |
| FA-CS-GO | MDA-MB-231 | PTT | 808 | 2 | 300 | n/a | 51.4 | n/a | [27] |
| PFTDPP; PFTDPP-SNAP NPs | MCF-7 | PTT | 808 | 1 | 300 | n/a | 57 | 48 | [28] |
| COF-366 NPs | 4T1 | PDT; PTT | 635 | 0.2; 1.5 | 300 | 23 | 60 | 15.07 | [29] |
| CPA nanocomposite | U87mg, HeLa, HepG2, COS7 | PTT | 808 | 1 | 600 | 12.9-45.9 | 50.1 | 72 (pH 7.4) 81 (pH 5.4) | [30] |
| SQ-NPs | MCF-7; A549 | PTT | 760 | 0.5 | 600 | 25.1 | n/a | 52.8 | [31] |
| Molybdenum(V)-based POMs | 4T1 | PTT | 1064 | 0.8 | 300 | n/a | 64.6 | n/a | [32] |
| cRGD@PT NPs | U87MG, C6, GL261, HU-VECs, and HeLa | PTT | 1064 | 1 | 300 | 20 | n/a | 43.15 | [33] |
| ISSzyme | 4T1; HU-VECs | PTT | 808 | 1 | 300 | 32.2 | 54.17 | 70.9 | [34] |
| SY1080 NPs | 4T1 | PTT | 808 | 1 | 300 | n/a | 52.7 | 22.3 | [35] |
| B-OMe-NPs | 4T1 | PTT | 735 | 1 | 600 | n/a | 68 | 66.5 | [36] |
| BQDs-PEG | 4T1 | PTT | 808 | 1 | 600 | n/a | 52 | 23.7 | [37] |
| Y16-Pr-PEG NPs | 4T1 | PTT | 808 | 1 | 300 | 25 | 50 | 82.4 | [38] |
| AuNSPHs | 4T1; bEnd.3 | PTT | 809 | 1 | 300 | 20 | n/a | 78.6 | [39] |
| PQs-TPA NPs | L929, HeLa, 4T1 | PTT | 808 | 0.8 | 300 | 46 | 73.8 | 59.5 | [40] |
| Mel-pDA-ICG | 4T1, CT26 | PTT | 808 | 1.2 | 180 | 28 | n/a | n/a | [41] |
| PT; mPT | HU-VECs, 4T1 | PTT | 808 | 1.5 | 600 | 45 | n/a | 51.84 | [42] |
| M1 NPs | 4T1 | PTT | 808 | 1 | 600 | n/a | 64 | 77.5 | [43] |
| PEGylated Sb-835 NPHs | 4T1, | PTT | 808 | 1 | 540 | 60 | n/a | 62.1 | [44] |
| Au44MBA26-Cy7 NCs | HeLa, | PTT | 808 | 1.5 | 360 | 40 | 70 | 65.12 | [45] |
| J-Au-CS-QD | 4T1, HEK293 | PTT | 808 | 0.5 | 600 | 28.3 | n/a | 43 | [46] |
| rGO-AuNP | SKOV-3 | PTT | 1061 | 0.25 | 300 | 61 | n/a | n/a | [47] |
| MNFs | L929; 4T1 | PTT | 808 | 1 | 600 | 50.9 | n/a | 41.7 | [48] |
| W18O49 nanorods | 4T1; HU-VECs | CDT; TT | n/a | n/a | n/a | 16.6 | n/a | n/a | [49] |
| PD-FA nanoparticles | HeLa; cos7 | PTT | 845 | 1 | 600 | n/a | 80 | 62.6 | [50] |
| DPP-SO; DPP-SS; DPP-SSe NPs | A549; H446 | PTT | 808 | 0.8 | 300 | 35 | n/a | 79.3 | [51] |
| Fe-ZDS | EMT-6; MCF-7 | PTT | 808 | 1.65 | 300 | 40 | n/a | 30.99 | [52] |
| POM | HUVEC, HeLa | CDT; PTT | 1060 | 1 | 300 | 37 | n/a | 47.8 | [53] |
| DPP-SS; DPP-OF; DPP-SF; DPP-SeF NP | A549; H446 | PTT | 808 | 0.75 | 300 | -; -; -; 37 | 50, 52, 56, 62 | 62 | [54] |
| MPDA-PEG | HEK-293T; A549 | PTT | 808 | 2 | 300 | 41.5 | 66.5 | 41 | [55] |
| TMB-F4TCNQ; TMB-TCNQ | 4T1, HeLa | PTT | 1060 | 1 | 300 | n/a | n/a | `; 48 | [56] |
| IDCIC NPs | 4T1 | PTT | 808 | 1 | 300 | 32.6 | 59.9 | 78.9 | [57] |
| GBP-FANB | HepG2; PC3 | PTT | 630 | 1 | 600 | n/a | 67 | n/a | [58] |
| IDT-BTzTD Pdots | HeLa | PTT | 808 | 0.8 | 600 | 32.1 | 57.4 | 53.9 | [59] |
| Au@Cu2‑xSe NPs | 4T1 | PTT | 808 | 1 | 300 | 20 | 45 | 56.6 | [60] |
| FA-DOX-ICG-PFP@Lip | Y79; Hu-VECs | PTT | 808 | 1 | 300 | >40 | >60 | n/a | [61] |
| MnCO@CNPpy | HeLa, MCF-7, L02 | PTT | 808 | 1 | 300 | 40 | n/a | 34.6 | [62] |
| GNS; Silica@GNS | MSC | PTT | 808 | 1 | 900 | 55 | 80 | n/a | [63] |
| ZPC NPs | HeLa; 4T1 | PDT; PTT | 660; 808 | 0.76; 2 | 300 | n/a | 69.1 | 30.99 | [64] |
| GNR@MNPs-Gd-64 Cu | Hep-2 | PTT | 808 | 1 | 300 | n/a | 60 | 45.3 | [65] |
| PFTQ-PEG-Gd NPs | 4T1 | PTT | 808 | 1 | 600; 300 | n/a | >60 | 26 | [66] |
| Ag2S@M-P-RGD | HeLa | PTT | 808 | 2 | 600 | n/a | 65 | 28.35 | [67] |
| Au@PB@Cu2O@BPQDs/PAH NCs | HeLa | PDT; PTT | 650 | 1.5 | 300 | n/a | 52.5 | 25.73 | [68] |
PS: n/a signifies that the information provided is not written or not detailed.
Summary of the photothermal effects of the agents in vivo
| Agents | Cells | Therapy | Tools | λRad (nm) | Power (W/cm2) | Time Rad (s) | ΔT (°C) | Tmax (°C) | Ref |
|---|---|---|---|---|---|---|---|---|---|
| PDA-AuNRs@MSN | 4T1 | PTT | n/a | 808 | 1 | 600 | n/a | 61.6 | [15] |
| DPP-BT NP | HeLa | PDT; PTT | FLIR E50; | 730 | 1 | 600 | n/a | 54 | [16] |
| mPEG-PEI-AuNRs; mPEG-PEI/CaNPs | MCF-7 | UST; PTT | 838A-H-O-S; FLIR E5 | 808 | 0.8 | 360; 600 | n/a | 51 | [17] |
| Au-MUA-TMA | U87MG | PTT | n/a | 808 | 1 | 600 | 7 | n/a | [18] |
| BBTD-1302 | 4T1 | PTT | n/a | 980 | 1 | n/a | 19 | 51 | [19] |
| PANI-ES@AOT | MCF-7 | PTT | IR camera | 808; 1064 | 1 | 300 | 9.47 | 46.14 | [20] |
| 1T-MoS2 nanodots; 2H-MoS2 | A549 | PTT | IR thermal imaging camera | 808; 1064 | 1 | 480 | 28.3; 12 | 65.7; - | [21] |
| BDT-TH; BDT-NDI | MCF-7 | (LED) PTT | IR thermal camera | 660 | 0.2 | 600 | n/a | 53 | [22] |
| BDP-Fe NPs | HeLa | PTT | n/a | 730 | n/a | 600 | 16.9 | 54 | [23] |
| AB-DS@BSA-N3 NYs | Hep-2 | PTT | Fluke Ti400 | 808 | 1 | 300 | 17.5 | [24] | |
| HMCS-PEG-GA | HepG2 | PTT | IR imaging camera | 808 | 1 | 300 | 14.7 | 43.7 | [25] |
| MNPH2 | Hep-2 | PTT | IR thermal camera | 808 | 1 | 300 | 25 | 59.2 | [26] |
| FA-CS-GO | MDA-MB-231 | PTT | IR thermal camera | 808 | 2 | 300 | n/a | 57.6 | [27] |
| PFTDPP; PFTDPP-SNAP NPs | MCF-7 | PTT | n/a | 808 | 1 | 600 | 28 | 60 | [28] |
| COF-366 NPs | 4T1 | PDT; PTT | IR thermal camera | 635 | 1.5 | 300 | n/a | 51 | [29] |
| CPA nanocomposite | 4T1 | PTT | Fluke Ti480 | 808 | 1 | 600 | 17.6 | 56.2 | [30] |
| SQ-NPs | 4T1 | PTT | n/a | 760 | 0.6 | 900 | 12 | [31] | |
| molybdenum(V)-based POMs | 4T1 | PTT | Fluke Ti400 | 1064 | 1.8 | 300 | 23 | 53.5 | [32] |
| cRGD@PT NPs | C6; GL261 | PTT | IR thermal camera | 1064 | 1; 0.5 | 300 | n/a | 54 | [33] |
| ISSzyme | 4T1 | PTT | IR radiation Thermal camera | 808 | 2 | 600 | n/a | 62 | [34] |
| SY1080 NPs | 4T1 | PTT | Fluke Ti400 | 808 | 1 | 300 | 19 | 51 | [35] |
| B-OMe-NPs | 4T1 | PDT; PTT | n/a | 735 | 1 | 600 | n/a | 51 | [36] |
| BQDs-PEG | 4T1 | PTT | IR thermal camera | 808 | 1 | 600 | n/a | 52 | [37] |
| Y16-Pr-PEG NPs | 4T1 | PDT; PTT | n/a | 808 | 1 | 600 | n/a | 60 | [38] |
| AuNSPHs | 4T1 | PTT | IR thermal camera | 808 | 1 | 300 | 18.9 | 52.9 | [39] |
| PQs-TPA NPs | 4T1 | PTT | IR thermal camera | 808 | 0.8 | 600 | 28 | 62 | [40] |
| Mel-pDA-ICG | 4T1 | PTT | NIR camera | 808 | 1.2 | 300 | n/a | 60 | [41] |
| PT; mPT | 4T1 | PTT | SolidSpec-3700 | 808 | 1.5 | 600 | n/a | n/a | [42] |
| M1 NPs | 4T1 | PTT | Infrared thermography | 808 | 1 | 600 | n/a | 55 | [43] |
| PEGylated Sb-835 NPHs | 4T1 | PTT | n/a | 808 | 1 | 540 | 58 | n/a | [44] |
| Au44MBA26-Cy7 NCs | 4T1 | PTT | n/a | 808 | 1 | 600 | n/a | 61.3 | [45] |
| J-Au-CS-QD | 4T1 | PTT | IR thermal camera | 808 | 0.5 | 600 | 30.4 | 52.8 | [46] |
| rGO-AuNP | SKOV-3 | PTT | FLIR SC300 | 1061 | 0.25 | 300 | n/a | n/a | [47] |
| MNFs | 4T1 | PTT | Fluke Ti400 | 808 | 1 | 600 | 18.3 | 51.4 | [48] |
| W18O49 nanorods | 4T1 | CDT; PTT | FLIR A300 | 808 | 1 | 300 | n/a | 42 | [49] |
| PD-FA nanoparticles | HeLa | PTT | IR thermal imaging camera (CEM, at an interval of 60 s) | 845 | 1 | 300 | n/a | 65 | [50] |
| DPP-SO; DPP-SS; DPP-SSe NPs | A549 | PTT | Fluke Ti480 | 808 | 0.8 | 300 | n/a | 65 | [51] |
| Fe-ZDS | EMT-6 | PTT | IR thermal imager | 808 | 0.82 | 360 | 45 | n/a | [52] |
| POM | tumor | CDT; PTT | IR thermal images | 1060 | 0.8 | 600 | n/a | n/a | [53] |
| DPP-SS; DPP-OF; DPP-SF; DPP-SeF NP | A549 | PTT | Fluke Ti480 | 808 | 0.75 | 300 | n/a | 55 | [54] |
| MPDA-PEG | A549 | PTT | IR camera | 808 | 1; 2 | 600; 300 | 26.6 | 56.7 | [55] |
| TMB-F4TCNQ; TMB-TCNQ | 4T1 | PTT | IR imager | 1060 | 1 | 300 | 18.8 | 53.6 | [56] |
| IDCIC NPs | 4T1 | PTT | Fluke Ti400 | 808 | 1 | 600 | 24.5 | 60.2 | [57] |
| GBP-FANB | HepG2; PC3 | PTT | FLIR Ax5 | 630 | 1 | 600 | 24.63 | 54.63 | [58] |
| IDT-BTzTD Pdots | 4T1 | PTT | Thermal camera | 808 | 0.8 | 600 | 58.5 | [59] | |
| Au@Cu2‑xSe NPs | 4T1 | PTT | Thermal camera | 808 | 1; 1.5 | 300 | 31.5 | 48.9 | [60] |
| FA-DOX-ICG-PFP@Lip | Y79 | PTT | Thermal imaging camera | 808 | 1 | 300 | n/a | 50.1 | [61] |
| MnCO@CNPpy | MCF-7 | PTT | Temperature transmitter | 808 | 1 | 300 | n/a | n/a | [62] |
| GNS; Silica@GNS | MDA-MB-231 | PTT | n/a | 808 | 1 | 900 | n/a | n/a | [63] |
| ZPC NPs | 4T1 | PDT; PTT | Fluke TiS55 | 660; 808 | 0.76; 2 | 300 | n/a | 53.5 | [64] |
| GNR@MNPs-Gd-64 Cu | Hep-2 | PTT | Fluke Ti400 | 808 | 1.5 | 300 | n/a | 58.5 | [65] |
| PFTQ-PEG-Gd NPs | 4T1 | PTT | FLIR E50 | 808 | 1 | 600 | n/a | 58.5 | [66] |
| Ag2S@M-P-RGD | HeLa | PTT | IR thermal imaging | 808 | 2 | 360 | n/a | 53 | [67] |
| Au@PB@Cu2O@BPQDs/PAH NCs | HeLa | PTT | PTT monitoring system (MG33) | 650 | 1.5 | 300 | 16.9 | n/a | [68] |
PS: n/a signifies that the information provided is not written or not detailed.
Optical characteristics of the agents
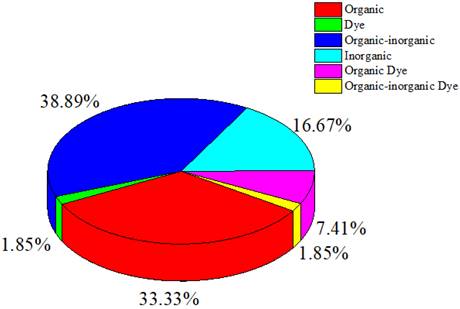
This review categorizes agents into organic, inorganic, hybrid organic-inorganic, organic dye, organic-inorganic dye, and dye categories. Organic or inorganic refers to compounds formed on basis of the organic or inorganic components, whereas hybrid organic-inorganic refers to mixed compounds formed from organic and inorganic components. Organic and organic-inorganic dyes are colorants derived from organic components or a mixture of organic-inorganic components. This classification is based on the information in the articles or material component of the agents used in the studies reviewed in this work.
Figure 2 indicates that the compounds used in photoacoustic imaging-guided PTT are mainly derived from a combination of organic-inorganic components, with compounds originating from organic and inorganic elements following closely. The prevalent use of organic materials stems from their potential for biocompatibility and biodegradability within biological systems compared with inorganic materials. Organic materials also exhibit high absorption in the far-red or near-infrared (NIR) region, presenting significant potential for PTT [12]. As shown in Table 1 and Figure 2, studies employing dyes as contrast and therapeutic agents are fewer than those employing other agent types.
Distribution of contrast agent types, including organic, inorganic, hybrid organic-inorganic, organic dye, organic-inorganic dye, and dye.
One of the main challenges in photoacoustic imaging is the limited depth of light penetration in biological tissues, especially in the visible and NIR-I regions. Additionally, some non-contact photoacoustic imaging methods may encounter constraints related to signal travel distance, especially when imaging deep tissues. These constraints can lead to lower resolution in deep tissues than direct contact imaging methods (Ying et al., 2024). These limitations reduce the effectiveness of imaging deep tissues and organs, limiting their clinical applications. Therefore, to enhance treatment effectiveness, developing techniques capable of overcoming these barriers is necessary, such as using radiation sources with longer wavelengths or developing contrast agents with optimized optical properties for better tissue penetration.
The wavelength spectrum regions of NIR can be divided into three channels: NIR-I (700-900 nm), NIR-IIa (1300-1400 nm), and NIR-IIb (1500-1700 nm) [13]. In this review, they were categorized into the visible region (400-700 nm), NIR-I (700-1000 nm), and NIR-II (1000-1700 nm) [14] because of the presence of agents with absorption wavelengths in the visible light region.
Table 2 summarizes the distribution of agents based on their absorption wavelengths, which is illustrated in Figure 3. In Figure 3 presents the development of agents that absorb at specific wavelengths. More agents are designed to be absorbed in the NIR-I wavelength region. However, studies using NIR-II are still fewer than those utilizing other wavelength ranges. The use of the NIR-II window (1000-1700 nm) was limited because of the absence of contrast agents with absorption capabilities in the NIR-II region [69]. They reported synthesizing photoacoustic contrast agents that could be absorbed in both the NIR-I (750 nm) and NIR-II (1064 nm) regions, directly comparing the resulting photoacoustic images. The findings indicated that the signal-to-noise ratio of the photoacoustic images generated at a wavelength of 1064 nm was higher than that at 750 nm.
Distribution of the wavelength absorbance of the agents.
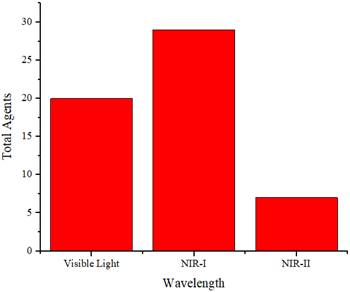
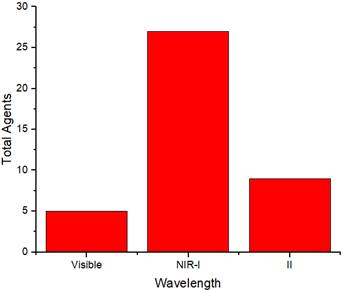
Figure 4 displays the distribution of wavelength usage as a radiation source for generating photoacoustic images. In this figure, the NIR-I region is more extensively used as a radiation source. The number of agents in each absorption region in Figure 3 is mostly the same as that in each wavelength region used to generate photoacoustic images in Figure 4. This indicates that the selection of wavelengths as a source for photoacoustic imaging is adjusted according to the agents' absorption wavelengths to maximize the obtained images. Moreover, the choice of photoacoustic imaging wavelengths is also determined by the depth of the object being imaged.
Distribution of photoacoustic imaging wavelengths.
PTT using in vitro methods
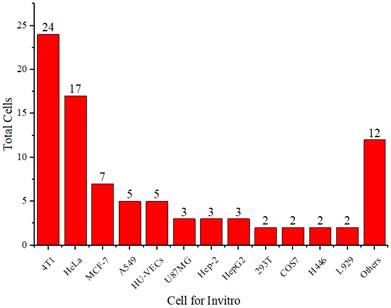
Table 3 summarizes the thermal characteristics of the agent compounds in the in vitro methods, including the cells used in vitro, laser irradiation, agent temperature increase, and agent photothermal conversion efficiency.
Figure 5 shows that 4T1 and HeLa cells are more frequently used than other cell types. The 4T1 cell line is a highly tumorigenic and invasive transplantable tumor cell line [70]. Unlike many tumor models, 4T1 can spontaneously metastasize from the primary tumor in the mammary gland to several distant sites, including the lymph nodes, blood, liver, lungs, brain, and bones.
Distribution of cell types used in vitro.
In addition to serving as contrast agents, these agents are used as cancer therapies through PTT. Therefore, these agents should reach temperatures sufficient to eliminate cancerous cells. Thermal cancer therapy is predominantly identified with temperatures ranging from 40 to 48°C sustained at the treated site for an hour or longer [71]. Moreover, temperatures above 42°C lead to cell death in various tissues [72]. Agents undergo laser irradiation for a specified duration to attain temperatures that can eradicate cancer cells. We cannot directly compare the effectiveness of the agents in temperature elevation because of varying radiation treatments (wavelengths, power, and duration). Figure 6 illustrates the rate of temperature increase calculated from the temperature change data and radiation duration applied to the agents. The highest rate of temperature increase was achieved by rGO-AuNP at 12.2 °C/min using a radiation wavelength of 1061 nm (0.25 W/cm2, 300 s) [47]. The exact reason why this agent exhibits a higher rate of temperature increase than other agents is not explicitly stated. Comparatively, for agents irradiated at the same radiation wavelength (NIR-II), Mo2C-derived polyoxometalate (POM) irradiated at 1060 nm (1 W/cm2, 300 s) achieves a rate of 7.4°C/min [53], and 2H-MoS2 irradiated at 1064 nm (1 W/cm2, 480 s) achieves a rate of 1.55 °C/min [21]. Among agents irradiated in the NIR-I or visible light region, the highest rate of increase is observed in the PQs-TPA NPs agent irradiated at a wavelength of 808 nm (0.8 W/cm2, 300 s) at 9.2 °C/min [40]. In the comparison of agent composition, rGO-AuNP containing Au, AuNSPHs, Au44MBA26-Cy7 NCs, Au@Cu2‑xSe NPs, J-Au-CS-QD, and Au-MUA-TMA exhibited significantly lower rates at 4°C/min, 6.7°C/min, 4°C/min, 2.83°C/min, and 2.8°C/min [18,39,45,46,60].
Distribution of temperature increase in vitro for the agents.
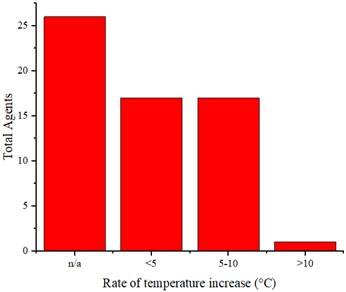
Figure 7 illustrates the distribution of the maximum temperature increases for the agents. Referring to the 40°C-48°C temperature range for cancer therapy [71], nearly all these agents can be applied for cancer treatment. Silica@GNS achieved the highest temperature at 80°C when irradiated with a wavelength of 808 nm (1 W/cm2, 900 s) [63]. Once again, we could not find a precise reason for this agent reaching a higher temperature than others. This necessitates a review of numerous factors such as pH, density, size, and even the composition of the agents.
Distribution of the achieved temperature increase by the agents.
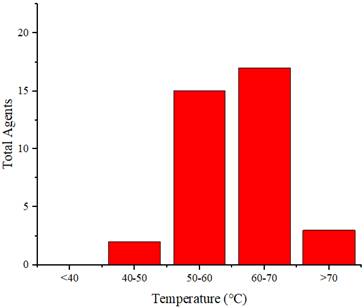
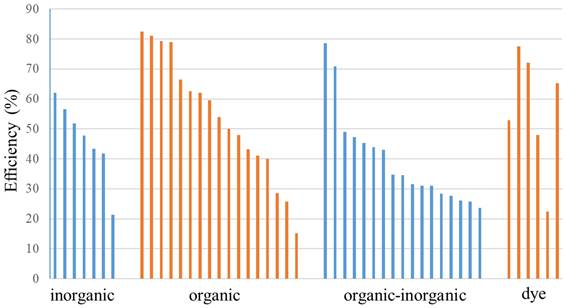
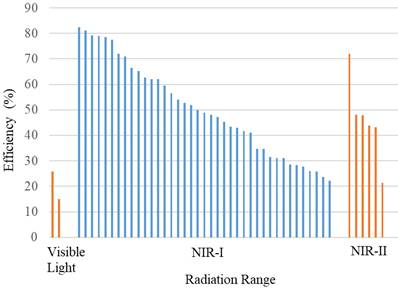
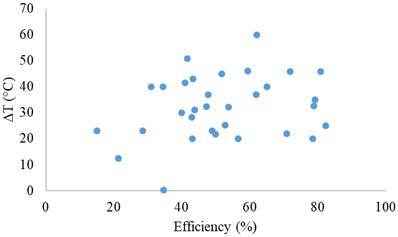
Figure 8 shows the thermal conversion efficiency distribution based on the agent type. Photothermal conversion efficiency refers to the ability of an agent to convert light energy into heat. This graph compares conversion efficiency among various materials such as organic, inorganic, hybrid, or dyes. This data is essential for understanding how each component enhances the effectiveness of photothermal applications in cancer therapy or local heating. Figure 9 shows the distribution of thermal conversion efficiency across different absorbance wavelength regions. This graph is used to determine the optimal efficiency at specific absorbance wavelength regions for medical applications. From these figures, we cannot conclude that the agent's components and the length of the radiation laser source directly affect the increase in photothermal conversion efficiency. Improving photothermal conversion facilitates enhanced efficiency in PTT and contributes to an increase in photoacoustic signals [18]. Figure 10 illustrates the relationship between photothermal conversion efficiency and the temperature change produced by the agent. The graph does not show a linear relationship between higher conversion efficiency and temperature increase. Figure 11 depicts the relationship between photothermal conversion efficiency and the temperature the agent achieves. This graph provides insights into the potential of each agent to reach the high temperatures necessary for therapeutic applications.
Photothermal conversion efficiency of agents based on their constituent components.
Photothermal conversion efficiency of agents based on their constituent components in radiation range.
Relationship between photothermal conversion efficiency and temperature change of the agents.
Agents' maximum attained temperature and photothermal conversion efficiency.
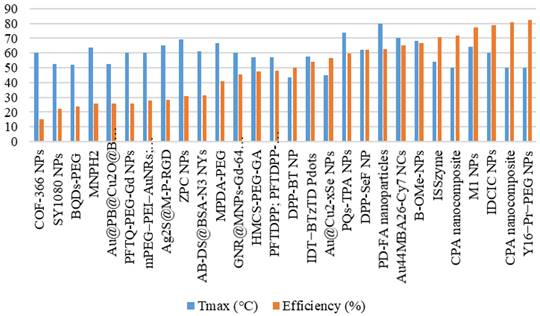
This information helps evaluate and compare agents' performance under intensive use conditions. Various parameters, such as the laser intensity applied, can influence the efficiency and temperature increase. The intensity of the laser light affects the amount of energy absorbed by the photosensitizer or nanoparticles, which in turn influences the rise in temperature. Therefore, essential factors affecting photothermal performance and the methods and mechanisms of laser-induced photothermal energy must be studied [73].
Additionally, the volume fraction, shape, size, and material type of the agent compounds influence the efficiency and temperature rise achievable by the agent [74]. The highest photothermal conversion efficiency is observed in Y16-Pr-PEG NPs, reaching 82.4%, irradiated at a wavelength of 808 nm (1 W/cm2, 300 s), resulting in a temperature increase of 25°C and achieving a temperature of 50°C [38]. In comparison, MPDA-PEG, irradiated at a wavelength of 808 nm (2 W/cm2, 300 s) [55], exhibits a lower photothermal conversion efficiency of 41%, a temperature increase of 41.5°C, and a temperature of 66.5°C.
Although photothermal therapy is promising as an exact treatment method, challenges remain in improving photothermal conversion efficiency and achieving uniform heat distribution within the tumor. Uneven heat distribution can result in incomplete tumor ablation and potential damage to surrounding healthy tissues. Further research is needed to develop new materials with optimized optical and thermal characteristics to enhance the efficiency of photothermal therapy. These parameters include heating conditions (laser intensity, wavelength, radius, and heating time), nanoparticle parameters (volume fraction, shape, size, and material), and boundary conditions (cooling methods and cooling time), all of which are applied to control therapeutic outcomes (Ren et al., 2022).
PTT using in vivo methods
Table 4 summarizes the thermal characteristics of the agent compounds in the in vivo methods, including the implanted cells in experimental animals, thermal camera tools, laser irradiation, and temperature increase of the agents.
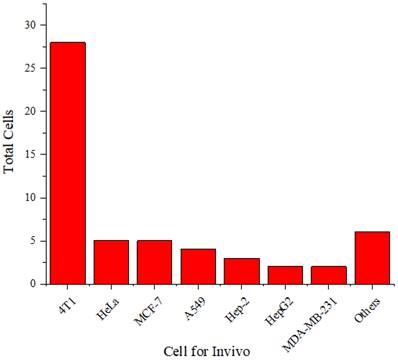
Figure 12 shows that the 4T1 cell line is more frequently used in experimental animals than other cell lines. The 4T1 tumor exhibits several characteristics that make it a suitable animal model for human breast cancer [70]. The progressive metastatic spread of 4T1 to lymph nodes and other organs is highly reminiscent of human breast cancer. The 4T1 tumor is also resistant to 6-thioguanine. This characteristic enables accurate counting of metastatic cells, even when spread at submicroscopic levels in distant organs.
Distribution of cells used in vivo.
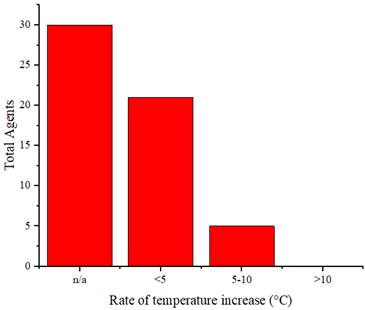
Similarly, as in in vitro studies, agents are used as a therapeutic agent for cancer implanted in experimental animals. These agents are injected into the experimental animals, accumulate in the cancer cells, and are then exposed to radiation, causing a sufficient increase in temperature to eliminate cancer cells. Figure 13 illustrates the distribution of the rate of temperature increase of the agents in vivo, whereas Figure 14 displays the distribution of the achieved temperature of the agents in vivo. Fe-ZDS at 7.5°C/min recorded the highest rate, with radiation at a wavelength of 808 nm (0.82 W/cm2, 360 s) [52]. Meanwhile, 1T-MoS2 nanodots achieved the maximum temperature increase at 65.7°C using radiation at a wavelength of 808 nm (1 W/cm2, 480 s). Figure 14 and Table 4 also indicate agents that can achieve a temperature range of 40°C-48°C, which is helpful for cancer therapy [71].
Distribution of the rate of temperature increase of the agents in vivo.
Distribution of temperatures achieved by the agents in vivo.
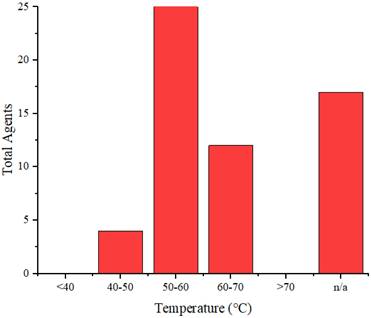
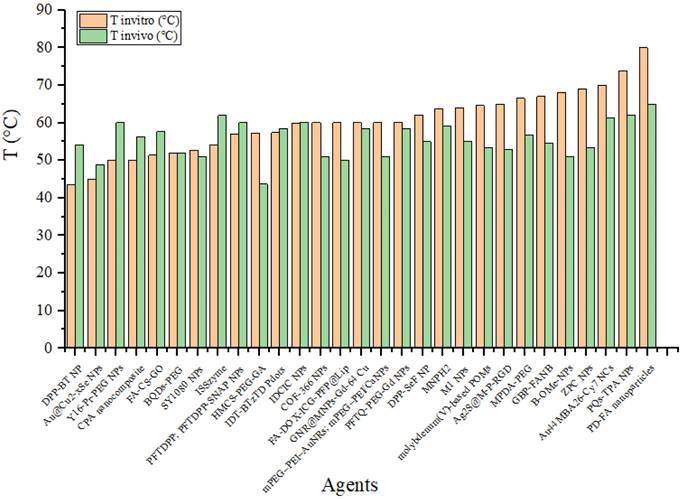
Figure 15 compares the agent's temperatures when irradiated in vitro and in vivo. This graph shows the differences in heating between the two conditions. This data is essential for understanding how the biological environment affects the agents' performance. It also helps assess whether laboratory results can be expected to be applied to practical applications in the human or animal body. A difference is observed in the agent's temperature when exposed to in vivo radiation, generally resulting in lower temperatures than when the agent is irradiated in an in vitro environment. This change may be due to the laser energy absorbed by the medium (experimental animal) before reaching the agent. However, some agents exhibit higher temperatures when tested in vivo than in vitro. For example, DPP-BT NP exhibited a temperature of 43.6°C at 100 μg/mL during in vitro testing and reached 54°C at 1 mg/mL in 200 µL in vivo [16]. Furthermore, the ISSzyme agent reached a temperature of 54.17°C when irradiated at a wavelength of 808 nm (1 W/cm2, 600 s) in vitro and during in vivo irradiation at the same wavelength (808 nm) but with a power of 2 W/cm2 for 600 s. Under in vivo conditions, the temperature increase was due to treatment modifications, such as changes in the agent's volume and alterations in the power of the radiation source.
Comparison of temperatures achieved by the agents in vitro and in vivo.
Conclusion
Components used as therapeutic and contrast agents in photoacoustic imaging-guided PTT have been extensively developed, displaying variations in organic, inorganic, and hybrid organic-inorganic compounds. However, further development of dye-type agents is required. Generally, therapeutic and contrast agent development tends to exhibit absorption in the NIR-I region compared with that in the NIR-II region. Developing agents with NIR-II absorption can offer advantages, including improvement in the contrast of photoacoustic imaging. These agents were then tested for PTT in vitro and in vivo, with 4T1 cells being the most frequently used. When irradiated with specific power and duration, the agents experience a temperature increase of over 40°C, which is sufficient to eliminate cancer cells. No specific relationship was found between the photothermal conversion efficiency and the temperature increase achieved by the agents. Enhancing photothermal conversion not only facilitates improved efficiency in PTT but also elevates photoacoustic signals. Therefore, a deeper exploration of the influence of photothermal conversion efficiency from other perspectives is necessary. There is substantial potential for extensive research involving further exploration in developing agents that act as therapeutic agents and serve as contrast agents to enhance photoacoustic imaging. The development of agents in the NIR-II region holds significant potential because of limited research in this domain.
Future works need to be carried out to develop potential contrast agents that enhance image contrast in photoacoustic imaging and possess therapeutic solid properties. The development of multifunctional agents capable of simultaneously detecting, mapping, and treating diseases will be a primary focus of future research. Additionally, there is potential to improve photothermal conversion efficiency of contrast agents and achieve more uniform heat distribution. Future research should focus on developing new materials with optimized optical and thermal characteristics to enhance the efficiency of photothermal therapy. Although there has been a significant amount of promising preclinical research, broader clinical validation is still needed to ensure the safety and effectiveness of these agents in photoacoustic and photothermal therapy for human treatment.
Further clinical studies will provide a better understanding of the clinical potential of these techniques and accelerate their application in clinical practice. Additionally, challenges remain in translating photoacoustic imaging and photothermal therapy techniques from the laboratory to the clinical practice. Future research should focus on developing methods that can facilitate the integration of these techniques into everyday clinical practice, including the development of more affordable and user-friendly hardware and the creation of standardized clinical protocols. Integrating photoacoustic imaging with other imaging modalities (e.g., MRI, CT) and combining photothermal therapy with other treatment strategies (e.g., chemotherapy, immunotherapy) could provide more comprehensive diagnostic and therapeutic solutions. Therefore, future research is expected to significantly contribute to developing more effective and safe photoacoustic and photothermal therapies.
Acknowledgements
We would like to thank Indonesia Endowment Funds for Education (LPDP) and Center for Higher Education Funding (BPPT) for supporting this work.
Author contributions
Donni Kis Apriyanto: data collection, formal analysis, and writing-original draft preparation. Rini Widyaningrum: conceptualization, result validation, and review. Mitrayana: supervision and reviewing. Andreas Setiawan: supervision and reviewing.
Data availability
The evidence data generated and/or analyzed during the current study are available from the corresponding author on reasonable request.
Competing Interests
The authors have declared that no competing interest exists.
References
1. Beard P. Biomedical photoacoustic imaging. Interface Focus [Internet]. 2011;1:602-31 Available at: https://royalsocietypublishing.org/doi/10.1098/rsfs.2011.0028
2. Moore C, Jokerst J V. Strategies for Image-Guided Therapy, Surgery, and Drug Delivery Using Photoacoustic Imaging. Theranostics [Internet]. 2019;9:1550-71 Available at: http://www.thno.org/v09p1550.htm
3. Das D, Sharma A, Rajendran P, Pramanik M. Another decade of photoacoustic imaging. Phys Med Biol [Internet]. 2021;66:05TR01 Available at: https://iopscience.iop.org/article/10.1088/1361-6560/abd669
4. Das D, Pramanik M. Combined ultrasound and photoacoustic imaging of blood clot during microbubble-assisted sonothrombolysis. J Biomed Opt [Internet]. 2019;24:1 Available at: https://www.spiedigitallibrary.org/journals/journal-of-biomedical-optics/volume-24/issue-12/121902/Combined-ultrasound-and-photoacoustic-imaging-of-blood-clot-during-microbubble/10.1117/1.JBO.24.12.121902.full
5. Mantri Y, Dorobek TR, Tsujimoto J, Penny WF, Garimella PS, Jokerst J V. Monitoring peripheral hemodynamic response to changes in blood pressure via photoacoustic imaging. Photoacoustics [Internet]. 2022;26:100345 Available at: https://linkinghub.elsevier.com/retrieve/pii/S2213597922000155
6. Fadhel MN, Appak Baskoy S, Wang Y, Hysi E, Kolios MC. Use of photoacoustic imaging for monitoring vascular disrupting cancer treatments. J Biophotonics [Internet]. 2023 16. Available at: https://onlinelibrary.wiley.com/doi/10.1002/jbio.202000209
7. Zhu Y, Lu X, Dong X, Yuan J, Fabiilli ML, Wang X. LED-Based Photoacoustic Imaging for Monitoring Angiogenesis in Fibrin Scaffolds. Tissue Eng Part C Methods [Internet]. 2019;25:523-31 Available at: https://www.liebertpub.com/doi/10.1089/ten.tec.2019.0151
8. Karthikesh MS, Yang X. Photoacoustic image-guided interventions. Exp Biol Med [Internet]. 2020;245:330-41 Available at: http://journals.sagepub.com/doi/10.1177/1535370219889323
9. Moore C, Chen F, Wang J, Jokerst J V. Listening for the therapeutic window: Advances in drug delivery utilizing photoacoustic imaging. Adv Drug Deliv Rev [Internet]. 2019;144:78-89 Available at: https://linkinghub.elsevier.com/retrieve/pii/S0169409X19300845
10. Montazar L, Mahani M, Khakbaz F, Divsar F, Yoosefian M. Carbon quantum dots and gold nanostructures on photothermal therapy for cancer treatment. J Photochem Photobiol A Chem [Internet]. 2023 115443. Available at: https://linkinghub.elsevier.com/retrieve/pii/S1010603023009085
11. Shi Y, Zhu D, Wang D. et al. Recent advances of smart AIEgens for photoacoustic imaging and phototherapy. Coord Chem Rev [Internet]. 2022;471:214725 Available at: https://linkinghub.elsevier.com/retrieve/pii/S0010854522003204
12. Algi MP, Sarıgöl R. Cross-linker engineering of hydrogel enables photothermal therapy and controlled drug release. J Drug Deliv Sci Technol [Internet]. 2023;89:104993 Available at: https://linkinghub.elsevier.com/retrieve/pii/S1773224723008456
13. Liu P, Mu X, Zhang X-D, Ming D. The Near-Infrared-II Fluorophores and Advanced Microscopy Technologies Development and Application in Bioimaging. Bioconjug Chem [Internet]. 2020;31:260-75 Available at: https://pubs.acs.org/doi/10.1021/acs.bioconjchem.9b00610
14. Dai H, Shen Q, Shao J, Wang W, Gao F, Dong X. Small Molecular NIR-II Fluorophores for Cancer Phototheranostics. Innov [Internet]. 2021;2:100082 Available at: https://linkinghub.elsevier.com/retrieve/pii/S2666675821000072
15. Wang J, Wu Y, Liu K. et al. PH/thermal dual-responsive multifunctional drug delivery system for effective photoacoustic imaging-guided tumor chemo/photothermal therapy. APL Bioeng. 2023;7:1-11
16. Wang Q, Dai Y, Xu J. et al. All-in-One Phototheranostics: Single Laser Triggers NIR-II Fluorescence/Photoacoustic Imaging Guided Photothermal/Photodynamic/Chemo Combination Therapy. Adv Funct Mater. 2019;29:1-12
17. Xu C, Wang Y, Wang E. et al. Effective Eradication of Tumors by Enhancing Photoacoustic-Imaging-Guided Combined Photothermal Therapy and Ultrasonic Therapy. Adv Funct Mater. 2021;31:1-10
18. Zhang R, Wang L, Wang X. et al. Acid-Induced In vivo Assembly of Gold Nanoparticles for Enhanced Photoacoustic Imaging-Guided Photothermal Therapy of Tumors. Adv Healthc Mater. 2020;9:1-10
19. Ye F, Huang W, Li C. et al. Near-Infrared Fluorescence/Photoacoustic Agent with an Intensifying Optical Performance for Imaging-Guided Effective Photothermal Therapy. Adv Ther. 2020;3:1-10
20. Zhang Y, Wang Y, Yang X, Yang Q, Li J, Tan W. Polyaniline Nanovesicles for Photoacoustic Imaging-Guided Photothermal-Chemo Synergistic Therapy in the Second Near-Infrared Window. Small. 2020;16:1-9
21. Zhou Z, Li B, Shen C. et al. Metallic 1T Phase Enabling MoS2 Nanodots as an Efficient Agent for Photoacoustic Imaging Guided Photothermal Therapy in the Near-Infrared-II Window. Small. 2020;16:1-9
22. Chang K, Gao D, Qi Q, Liu Y, Yuan Z. Engineering biocompatible benzodithiophene-based polymer dots with tunable absorptions as high-efficiency theranostic agents for multiscale photoacoustic imaging-guided photothermal therapy. Biomater Sci. 2019;7:1486-92
23. Ou C, Zhang Y, Ge W. et al. A three-dimensional BODIPY-iron(III) compound with improved H2O2-response for NIR-II photoacoustic imaging guided chemodynamic/photothermal therapy. Chem Commun. 2020;56:6281-4
24. Zheng Z, Chen Q, Dai R. et al. A continuous stimuli-responsive system for NIR-II fluorescence/photoacoustic imaging guided photothermal/gas synergistic therapy. Nanoscale. 2020;12:11562-72
25. Sun J, Li Y, Teng Y, Wang S, Guo J, Wang C. NIR-controlled HSP90 inhibitor release from hollow mesoporous nanocarbon for synergistic tumor photothermal therapy guided by photoacoustic imaging. Nanoscale. 2020;12:14775-87
26. Sun J, Cai W, Sun Y, Guo C, Zhang R. Facile synthesis of melanin-dye nanoagent for NIR-II fluorescence/photoacoustic imaging-guided photothermal therapy. Int J Nanomedicine [Internet]. 2020;15:10199-213 Available at: https://www.dovepress.com/facile-synthesis-of-melanin-dye-nanoagent-for-nir-ii-fluorescencephoto-peer-reviewed-article-IJN
27. Jun SW, Manivasagan P, Kwon J. et al. Folic acid-conjugated chitosan-functionalized graphene oxide for highly efficient photoacoustic imaging-guided tumor-targeted photothermal therapy. Int J Biol Macromol [Internet]. 2020;155:961-71 Available at: https://doi.org/10.1016/j.ijbiomac.2019.11.055
28. Li J, Jiang R, Wang Q. et al. Semiconducting polymer nanotheranostics for NIR-II/Photoacoustic imaging-guided photothermal initiated nitric oxide/photothermal therapy. Biomaterials [Internet]. 2019;217:119304 Available at: https://doi.org/10.1016/j.biomaterials.2019.119304
29. Wang D, Zhang Z, Lin L. et al. Porphyrin-based covalent organic framework nanoparticles for photoacoustic imaging-guided photodynamic and photothermal combination cancer therapy. Biomaterials [Internet]. 2019;223:119459 Available at: https://doi.org/10.1016/j.biomaterials.2019.119459
30. Wu J, Williams GR, Zhu Y. et al. Ultrathin chalcogenide nanosheets for photoacoustic imaging-guided synergistic photothermal/gas therapy. Biomaterials [Internet]. 2021;273:120807 Available at: https://doi.org/10.1016/j.biomaterials.2021.120807
31. Rong X, Xia X, Wang R. et al. Near-infrared and highly photostable squaraine-based nanoparticles for photoacoustic imaging guided photothermal therapy. Dye Pigment [Internet]. 2023;211:111055 Available at: https://doi.org/10.1016/j.dyepig.2022.111055
32. Han Y, Qu B, Li J. et al. A simple POM clusters for in vivo NIR-II photoacoustic imaging-guided NIR-II photothermal therapy. J Inorg Biochem [Internet]. 2020;209:111121 Available at: https://doi.org/10.1016/j.jinorgbio.2020.111121
33. He Y, Pan Y, Zhao X, Fan W, Cai Y, Mou X. NIR-II absorptive dithienopyrrole-thiadiazolobenzotriazole conjugated polymer for photoacoustic imaging-guided glioblastoma multiforme photothermal therapy. Acta Biomater. 2022;152:546-61
34. Chen C, Chen Y, Wang X. et al. In situ synthesized nanozyme for photoacoustic-imaging-guided photothermal therapy and tumor hypoxia relief. iScience [Internet]. 2023;26:106066 Available at: https://doi.org/10.1016/j.isci.2023.106066
35. Zhang R, Wang Z, Xu L. et al. Rational Design of a Multifunctional Molecular Dye with Single Dose and Laser for Efficiency NIR-II Fluorescence/Photoacoustic Imaging Guided Photothermal Therapy. Anal Chem. 2019;91:12476-83
36. Xing X, Yang K, Li B. et al. Boron Dipyrromethene-Based Phototheranostics for Near Infrared Fluorescent and Photoacoustic Imaging-Guided Synchronous Photodynamic and Photothermal Therapy of Cancer. J Phys Chem Lett. 2022;13:7939-46
37. Guo T, Tang Q, Guo Y. et al. Boron Quantum Dots for Photoacoustic Imaging-Guided Photothermal Therapy. ACS Appl Mater Interfaces. 2021;13:306-11
38. Yang K, Long F, Liu W. et al. A-DA′D-A Structured Organic Phototheranostics for NIR-II Fluorescence/Photoacoustic Imaging-Guided Photothermal and Photodynamic Synergistic Therapy. ACS Appl Mater Interfaces. 2022;14:18043-52
39. Wang Y, Yang Y, Yang L. et al. Gold Nanostar@Polyaniline Theranostic Agent with High Photothermal Conversion Efficiency for Photoacoustic Imaging-Guided Anticancer Phototherapy at a Low Dosage. ACS Appl Mater Interfaces [Internet]. 2022;14:28570-80 Available at: https://pubs.acs.org/doi/10.1021/acsami.2c05679
40. Zhang LP, Kang L, Li X, Liu S, Liu T, Zhao Y. Pyrazino[2,3-g]quinoxaline-Based Nanoparticles as Near-Infrared Phototheranostic Agents for Efficient Photoacoustic-Imaging-Guided Photothermal Therapy. ACS Appl Nano Mater. 2021;4:2019-29
41. Guo H, Cao Z, Li J. et al. Integrating Bacteria with a Ternary Combination of Photosensitizers for Monochromatic Irradiation-Mediated Photoacoustic Imaging-Guided Synergistic Photothermal Therapy. ACS Nano. 2023;17:5059-71
42. Li CQ, Hou XL, Jiang DX. et al. Binary Pt/Te Nanoheterostructures with High Photothermal Conversion Efficiency and Anti-inflammatory Action for Enhanced Photothermal Therapy of 4T1 Breast Tumors Guided by Photoacoustic Imaging. ACS Sustain Chem Eng. 2022;10:16598-610
43. Li B, Pang E, Zhao S. et al. Aggregation-Enhanced Photophysical Performance of D-π-A Structured Hemicyanine for NIR-II Fluorescent and Photoacoustic Imaging-Guided Photothermal Therapy. Chem Biomed Imaging. 2023;1:541-9
44. Chen Y, Wang M, Zheng K. et al. Antimony Nanopolyhedrons with Tunable Localized Surface Plasmon Resonances for Highly Effective Photoacoustic-Imaging-Guided Synergistic Photothermal/Immunotherapy. Adv Mater. 2021;33:1-10
45. Yang G, Mu X, Pan X. et al. Ligand engineering of Au44 nanoclusters for NIR-II luminescent and photoacoustic imaging-guided cancer photothermal therapy. Chem Sci. 2023;14:4308-18
46. Dai X, Zhao X, Liu Y. et al. Controlled Synthesis and Surface Engineering of Janus Chitosan-Gold Nanoparticles for Photoacoustic Imaging-Guided Synergistic Gene/Photothermal Therapy. Small. 2021;17:1-14
47. Wang Z, Sun X, Huang T, Song J, Wang Y. A Sandwich Nanostructure of Gold Nanoparticle Coated Reduced Graphene Oxide for Photoacoustic Imaging-Guided Photothermal Therapy in the Second NIR Window. Front Bioeng Biotechnol. 2020;8:1-10
48. Gao F, Miao Y, Ma H, Zhang T, Fan H, Zhao L. Boosting the photothermal performance of vacancy-rich MoSe2-: Xnanoflowers for photoacoustic imaging guided tumor chemo-photothermal therapy. Nanoscale. 2021;13:14960-72
49. Guo Q, Wang D, Yang G. Photoacoustic imaging guided photothermal and chemodynamic combined therapy for cancer using 'All in one' W18O49 nanorod agent. J Biomed Nanotechnol. 2019;15:2090-9
50. Qiu T, Lan Y, Wei Z. et al. In vivo multi-scale photoacoustic imaging guided photothermal therapy of cervical cancer based on customized laser system and targeted nanoparticles. Int J Nanomedicine. 2021;16:2879-96
51. Jin X, Xing X, Deng Q, Qing W, Liu Z, Huang Y. Molecular engineering of diketopyrrolopyrrole-conjugated polymer nanoparticles by chalcogenide variation for photoacoustic imaging guided photothermal therapy. J Mater Chem B. 2021;9:3153-60
52. Liang G, Han J, Xing D. Precise Tumor Photothermal Therapy Guided and Monitored by Magnetic Resonance/Photoacoustic Imaging using A Safe and pH-Responsive Fe(III) Complex. Adv Healthc Mater. 2021;10:1-13
53. Liu G, Zhu J, Guo H. et al. Mo2C-Derived Polyoxometalate for NIR-II Photoacoustic Imaging-Guided Chemodynamic/Photothermal Synergistic Therapy. Angew Chemie - Int Ed. 2019;58:18641-6
54. Liu F, Ma F, Chen Q. et al. Synergistic non-bonding interactions based on diketopyrrolo-pyrrole for elevated photoacoustic imaging-guided photothermal therapy. Biomater Sci. 2021;9:908-16
55. Zhang L, Yang P, Guo R, Sun J, Xie R, Yang W. Multifunctional mesoporous polydopamine with hydrophobic paclitaxel for photoacoustic imaging-guided chemo-photothermal synergistic therapy. Int J Nanomedicine. 2019;14:8647-63
56. Ou C, Na W, Ge W. et al. Biodegradable Charge-Transfer Complexes for Glutathione Depletion Induced Ferroptosis and NIR-II Photoacoustic Imaging Guided Cancer Photothermal Therapy. Angew Chemie. 2021;133:8238-44
57. Li B, Gan Y, Yang K. et al. Acceptor-donor-acceptor structured phototheranostics for near-infrared II fluorescent and photoacoustic imaging-guided photodynamic and photothermal synergistic therapy. Sci China Mater. 2023;66:385-94
58. Tian R, Zhu L, Qin Z, Wang G, Wang J, Zhang H. Glypican-3 (GPC3) targeted Fe3O4 core/Au shell nanocomplex for fluorescence/MRI/photoacoustic imaging-guided tumor photothermal therapy. Biomater Sci. 2019;7:5258-69
59. Men X, Chen H, Sun C. et al. Thermosensitive Polymer Dot Nanocomposites for Trimodal Computed Tomography/Photoacoustic/Fluorescence Imaging-Guided Synergistic Chemo-Photothermal Therapy. ACS Appl Mater Interfaces. 2020;12:51174-84
60. Zhang L, Jiang C, Li B. et al. A core-shell Au@Cu2-xSe heterogeneous metal nanocomposite for photoacoustic and computed tomography dual-imaging-guided photothermal boosted chemodynamic therapy. J Nanobiotechnology [Internet]. 2021;19:1-18 Available at: https://doi.org/10.1186/s12951-021-01159-x
61. Li M, Bian X, Chen X. et al. Multifunctional liposome for photoacoustic/ultrasound imaging-guided chemo/photothermal retinoblastoma therapy. Drug Deliv [Internet]. 2022;29:519-33 Available at: https://doi.org/10.1080/10717544.2022.2032876
62. Lin Y, Zhong W, Wang M, Chen Z, Lu C, Yang H. Multifunctional Carbon Monoxide Prodrug-Loaded Nanoplatforms for Effective Photoacoustic Imaging-Guided Photothermal/Gas Synergistic Therapy. ACS Appl Bio Mater. 2021;4:4557-64
63. Chen Y, Xu C, Cheng Y, Cheng Q. Photostability enhancement of silica-coated gold nanostars for photoacoustic imaging guided photothermal therapy. Photoacoustics [Internet]. 2021;23:100284 Available at: https://doi.org/10.1016/j.pacs.2021.100284
64. Sun L, Jiao X, Liu W. et al. Novel Oxygen-Deficient Zirconia (ZrO2- x) for Fluorescence/Photoacoustic Imaging-Guided Photothermal/Photodynamic Therapy for Cancer. ACS Appl Mater Interfaces. 2019;11:41127-39
65. Sun J, Li L, Cai W, Chen A, Zhang R. Multifunctional Hybrid Nanoprobe for Photoacoustic/PET/MR Imaging-Guided Photothermal Therapy of Laryngeal Cancer. ACS Appl Bio Mater. 2021;4:5312-23
66. Hu X, Tang Y, Hu Y. et al. Gadolinium-chelated conjugated polymer-based nanotheranostics for photoacoustic/magnetic resonance/NIR-II fluorescence imaging-guided cancer photothermal therapy. Theranostics. 2019;9:4168-81
67. Li C, Yang XQ, An J. et al. A near-infrared light-controlled smart nanocarrier with reversible polypeptide-engineered valve for targeted fluorescence-photoacoustic bimodal imaging-guided chemo-photothermal therapy. Theranostics. 2019;9:7666-79
68. Zheng T, Zhou T, Feng X, Shen J, Zhang M, Sun Y. Enhanced Plasmon-Induced Resonance Energy Transfer (PIRET)-Mediated Photothermal and Photodynamic Therapy Guided by Photoacoustic and Magnetic Resonance Imaging. ACS Appl Mater Interfaces. 2019;11:31615-26
69. Jiang Y, Upputuri PK, Xie C. et al. Broadband Absorbing Semiconducting Polymer Nanoparticles for Photoacoustic Imaging in Second Near-Infrared Window. Nano Lett [Internet]. 2017;17:4964-9 Available at: https://pubs.acs.org/doi/10.1021/acs.nanolett.7b02106
70. Pulaski BA, Ostrand-Rosenberg S. Mouse 4T1 Breast Tumor Model. Curr Protoc Immunol [Internet]. 2000 39. Available at: https://currentprotocols.onlinelibrary.wiley.com/doi/10.1002/0471142735.im2002s39
71. Chicheł A, Skowronek J, Kubaszewska M, Kanikowski M. Hyperthermia - description of a method and a review of clinical applications. Reports Pract Oncol Radiother [Internet]. 2007;12:267-75 Available at: https://linkinghub.elsevier.com/retrieve/pii/S150713671060065X
72. Cherukuri P, Glazer ES, Curley SA. Targeted hyperthermia using metal nanoparticles. Adv Drug Deliv Rev [Internet]. 2010;62:339-45 Available at: https://linkinghub.elsevier.com/retrieve/pii/S0169409X09003445
73. Deng H, Wang L, Tang D, Zhang Y, Zhang L. Review on the laser-induced performance of photothermal materials for ignition application. Energ Mater Front [Internet]. 2021;2:201-17 Available at: https://linkinghub.elsevier.com/retrieve/pii/S2666647221000476
74. Jain PK, Lee KS, El-Sayed IH, El-Sayed MA. Calculated Absorption and Scattering Properties of Gold Nanoparticles of Different Size, Shape, and Composition: Applications in Biological Imaging and Biomedicine. J Phys Chem B [Internet]. 2006;110:7238-48 Available at: https://pubs.acs.org/doi/10.1021/jp057170o
Author contact
![]() Corresponding author: Rini Widyaningrum, Email: rinihapsaraac.id.
Corresponding author: Rini Widyaningrum, Email: rinihapsaraac.id.